

“📊 The quarterly DMR provides data analysis from 75 publishers, summarized into 10 key insights, all focussing on gaining subscribers and paid content.”
12 months on from its first issue, we thought it was high time to look back over what we’d learnt from the Digital Media Review so far. With this in mind, Poool and GESTE held a webinar on 8th December 2020, inspired no doubt by our conversations with publishers, who rely heavily on gaining online subscribers. During our exchanges, certain questions came up time and time again.
Such as:
- Only 10% of our traffic is on paid content - is this enough to optimize conversion of readers into subscribers?
- 18% of readers are presented with our paywall every month - is this a high or low percentage compared to others in the industry?
Questions of this type are why we started the DMR in the first place. We wanted to give every publisher the opportunity to compare their ‘premium’ strategy with market averages, drawing insights from data and allowing for the most optimal business decisions to be made.
It therefore made a lot of sense to organize a webinar for more than just the 75 DMR members, sharing what we’ve learnt in our first 4 editions. So, if you fancy listening rather than reading, you can find the replay of 10 insights from the DMR webinar here.
As with all webinars, we know not everyone could make it and, for some, 30 minutes is a bit of a stretch, so why not summarize key points in writing.
So, voila! A written account of our short-but-sweet webinar.
Happy reading!
PART 1: Premium and subscriber-only content is taking up an increasingly larger percentage of articles on publisher’s websites.
Over the past few years, content that we call ‘paid’ or ‘premium’ has become increasingly present on publisher’s websites, and not just in France. Since 2015, America’s main publishers now have more paid content online than free, meaning the majority of their articles are hidden behind a paywall (find out more about the subject here).
This is where Digital Media Review comes in. With GESTE, we wanted to measure the extent to which online subscribers have become increasingly more important for publishers. Over the last 12-months, we’ve monitored this and come up with 2 key insights.
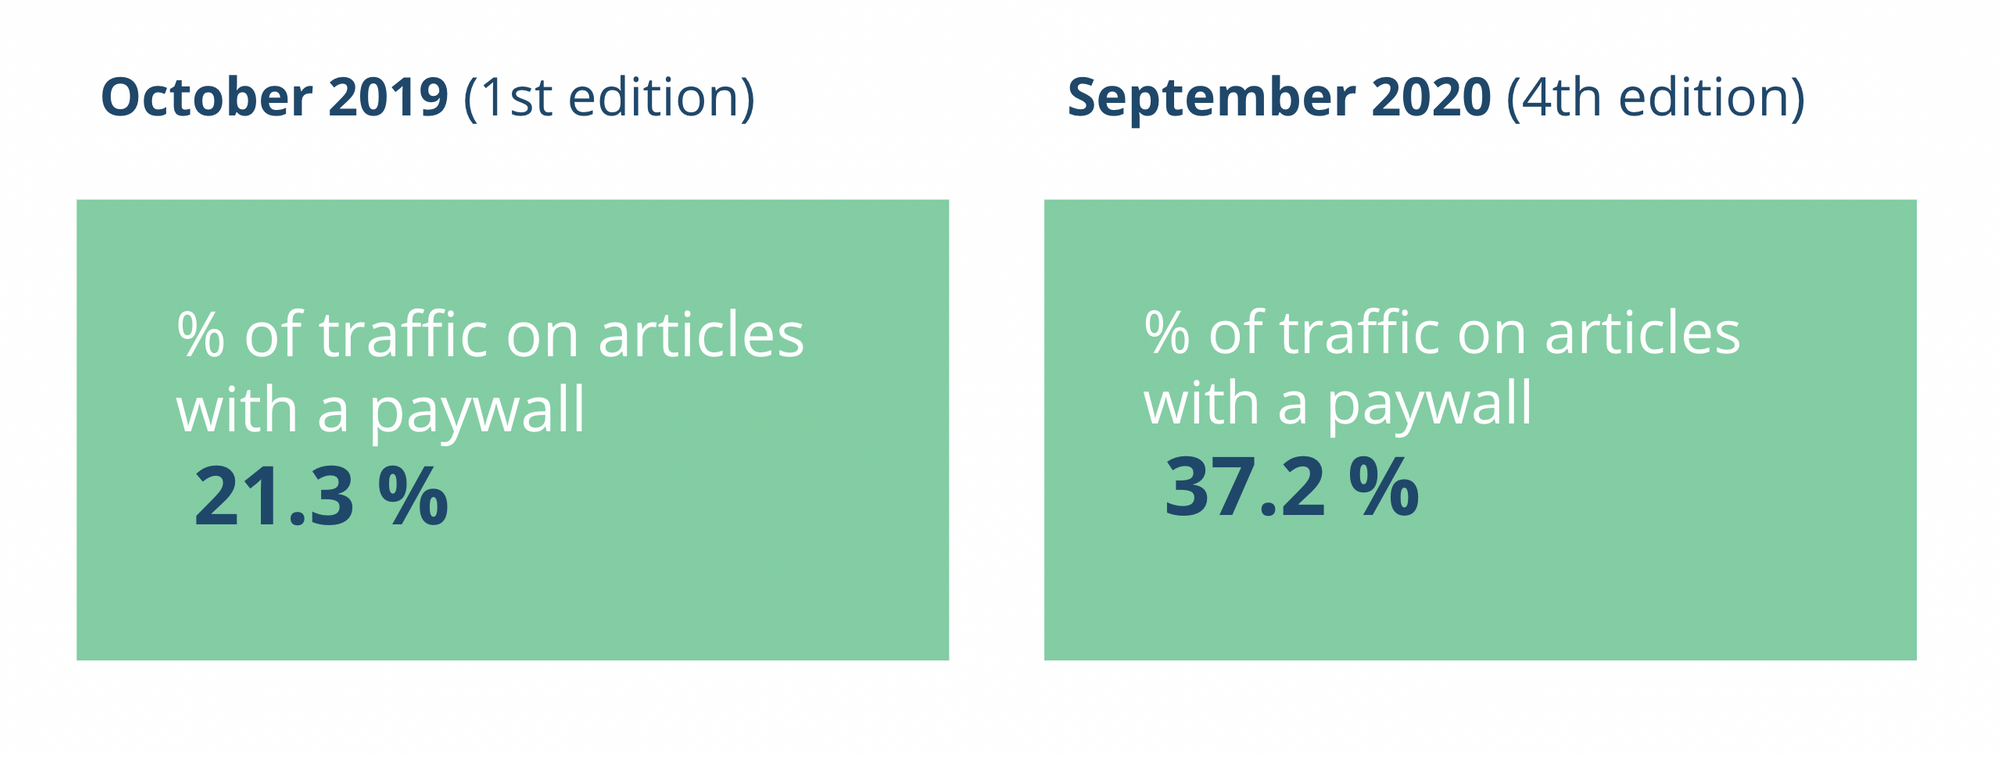
Insight #1: Premium and online subscriptions are taking up increasingly more space in publishers’ strategies.
Insight #2: And, therefore, readers are more frequently presented with a paywall and subscription offers.
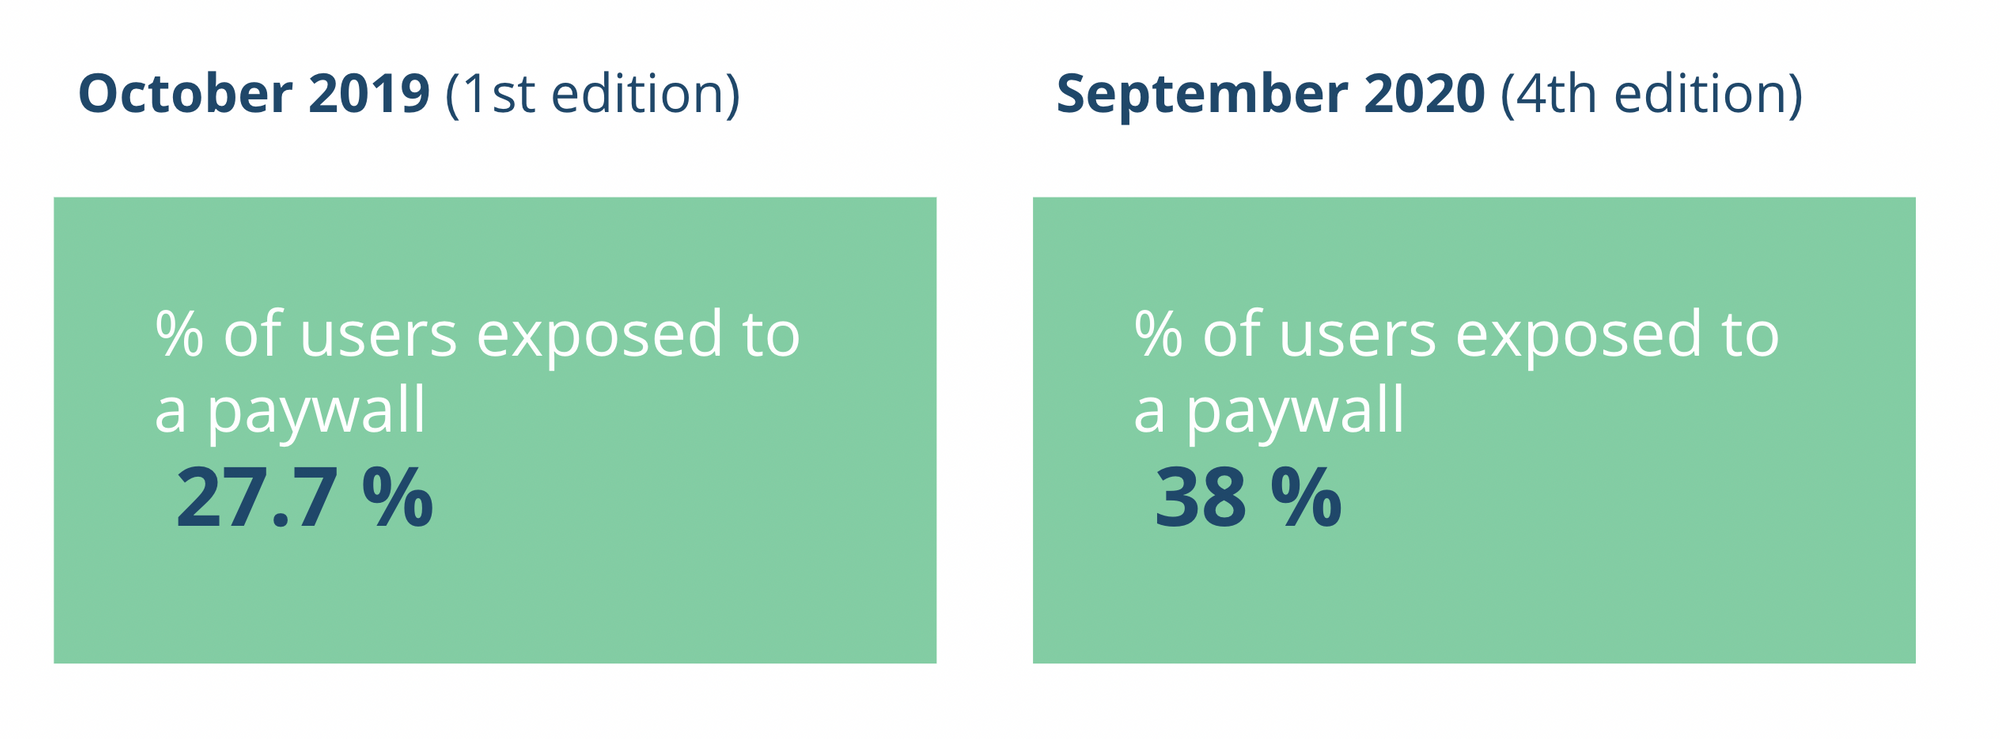
Our analysis: It’s amazing to see how publishers are putting increasingly more value on online subscription strategies. In only a year, the percentage of traffic on paid content has gone from 21% to more than 37%, representing a very rapid rise. This increase, as we can see in our second insight, has had a direct impact on how frequently readers are faced with a paywall or shown a subscription offer.
NB: What do we mean by ‘traffic on paid content’? To simplify it, if 100 articles were read on a website, how many of those were free for the reader (without a paywall) and how many needed to be paid for (with a paywall). This shouldn’t be confused with the overall number of paid articles. A publisher could produce 80% paid content, but only have 5% traffic on paid content.
Our recommendations: As you’ll see below, this insight is hugely important in the process of converting readers into subscribers. With this in mind, we strongly recommend that you follow and analyse this data using analytics tools.
PART 2: Conversion rates are affected by the visibility of paid content.
These two insights will have a direct impact on your online subscription strategy, which is of course our focus here.
Insight #3: Premium content plays a powerful role in conversion (up to a certain point).
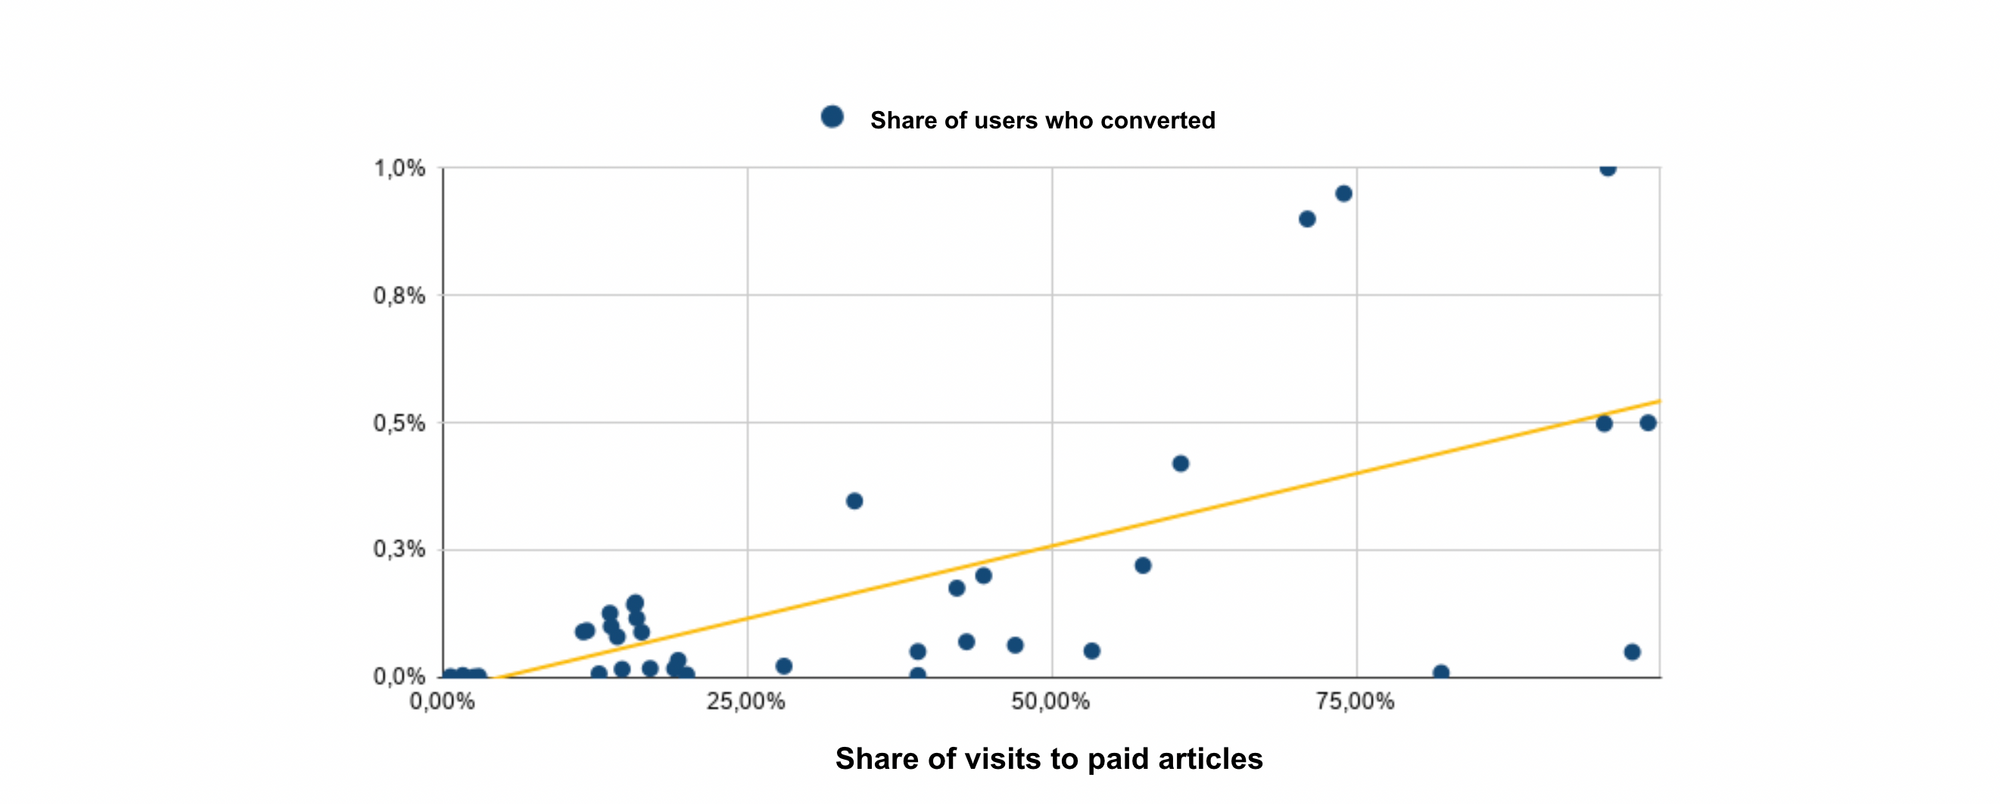
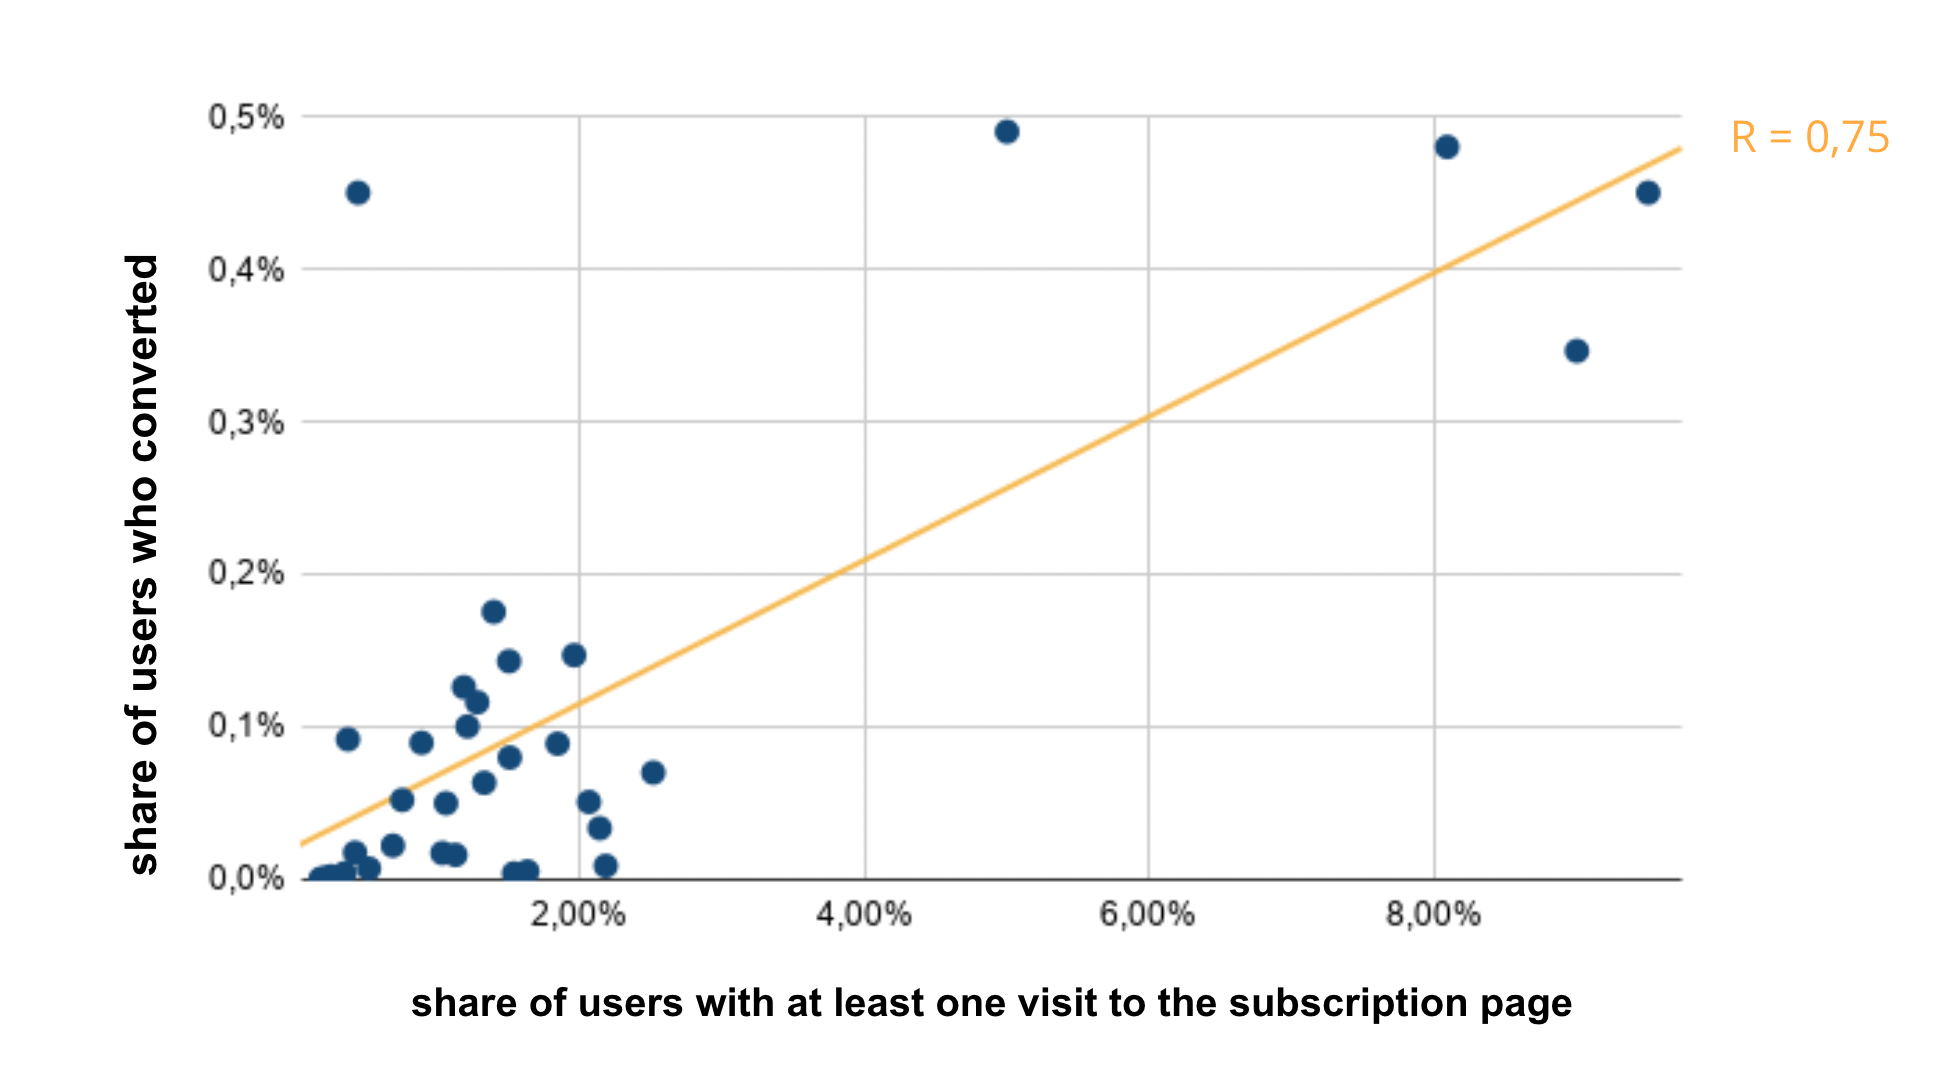
Insight #4: There’s a correlation between the percentage of traffic on paid (compared to free) content and the reader-to-subscriber conversion rate.
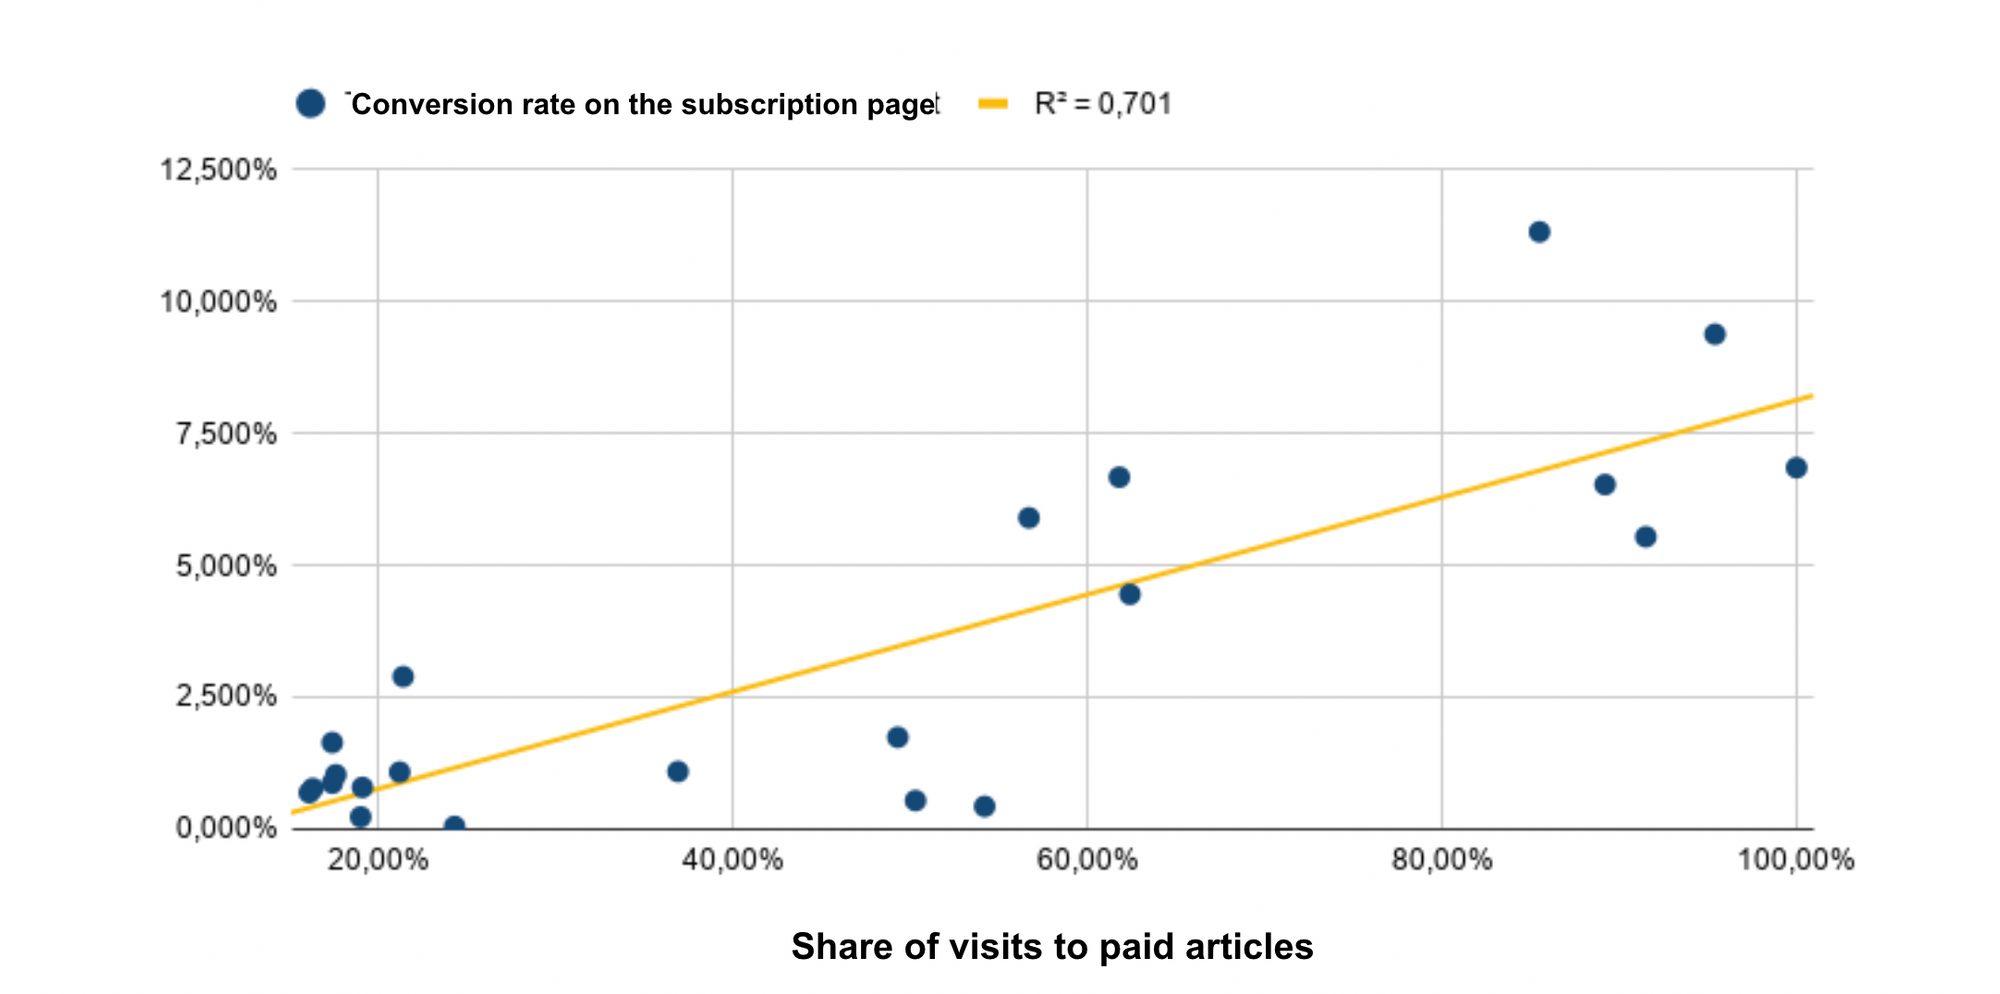
Our analysis: The conversion traffic and traffic in the subscription tunnel seem to partly correlate with the visibility of paid content. If a publisher has less than 10% visibility of blocked content on their site, they won’t have any, or very few, visits to their subscription page. If, however, we move to 10-40% visibility of paid content, the amount of traffic in the subscription tunnel and the rate of conversion will both increase. We can see this from our two insight points.
Our recommendations: If the visibility of paid content seems to correlate with conversion (although notably only to a certain extent), it would appear wise to produce more premium content in order to increase conversions. A publisher produces more premium content, their site has more premium content visible and they gain more conversions of readers into subscribers. Simple?
Unfortunately not. Some regional publishers, for example, produce 80% paid content (usually very local online journals) but they only have 5-15% visibility rate for their paid content. Why is this? Generally, it boils down to the content that is prioritized on the homepage, within categories, etc. The most visible articles are generally national news and are free to read.
A second point which contradicts these insights is the cost and time of putting our advice into practice. If you want quick results, then perhaps this isn’t the best strategy for you at the moment.
So what option is left? Arguably the quickest and least costly is to simply work on the visibility of paid content. This will allow you to optimize conversions without increasing spending and with the same organization of your site.
There are multiple ways of achieving this:
- Prioritize paid content on your home page
- Recommend paid content to readers within other (free) articles
- Build in rules that push paid content to the top within ‘native ads’
- Integrate more paid content into newsletters and article recommendations
- Promote premium articles via push notifications or social media
PART 3: The visibility of paid content also impacts reader frustration as well as the rate of readers leaving the site.
If it was simply a matter of increasing pressure on readers to subscribe in order to improve conversion rates, then Poool wouldn’t exist. The DMR neither. Unfortunately, though, the visibility of paid content has an equally significant impact on readers’ frustration and on the rate of departure from the site.
But is this really a problem? Let’s have a look in closer detail.
Insight #5: The pressure created by a paywall has an impact on both the conversion AND on the frustration held by readers.
Our analysis: As we saw in part 2, the visibility of paid content is correlated, to a certain point, with the conversion of readers into subscribers. So, given this and part 3, frustration amongst readers is equally important in the conversion process. However, it isn’t the only factor in a reader’s decision to subscribe or not. The publisher’s brand, the value proposition, the user experience, etc. will all play important roles in the conversion process.
Acquiring new subscribers is therefore somewhere between engagement and frustration.
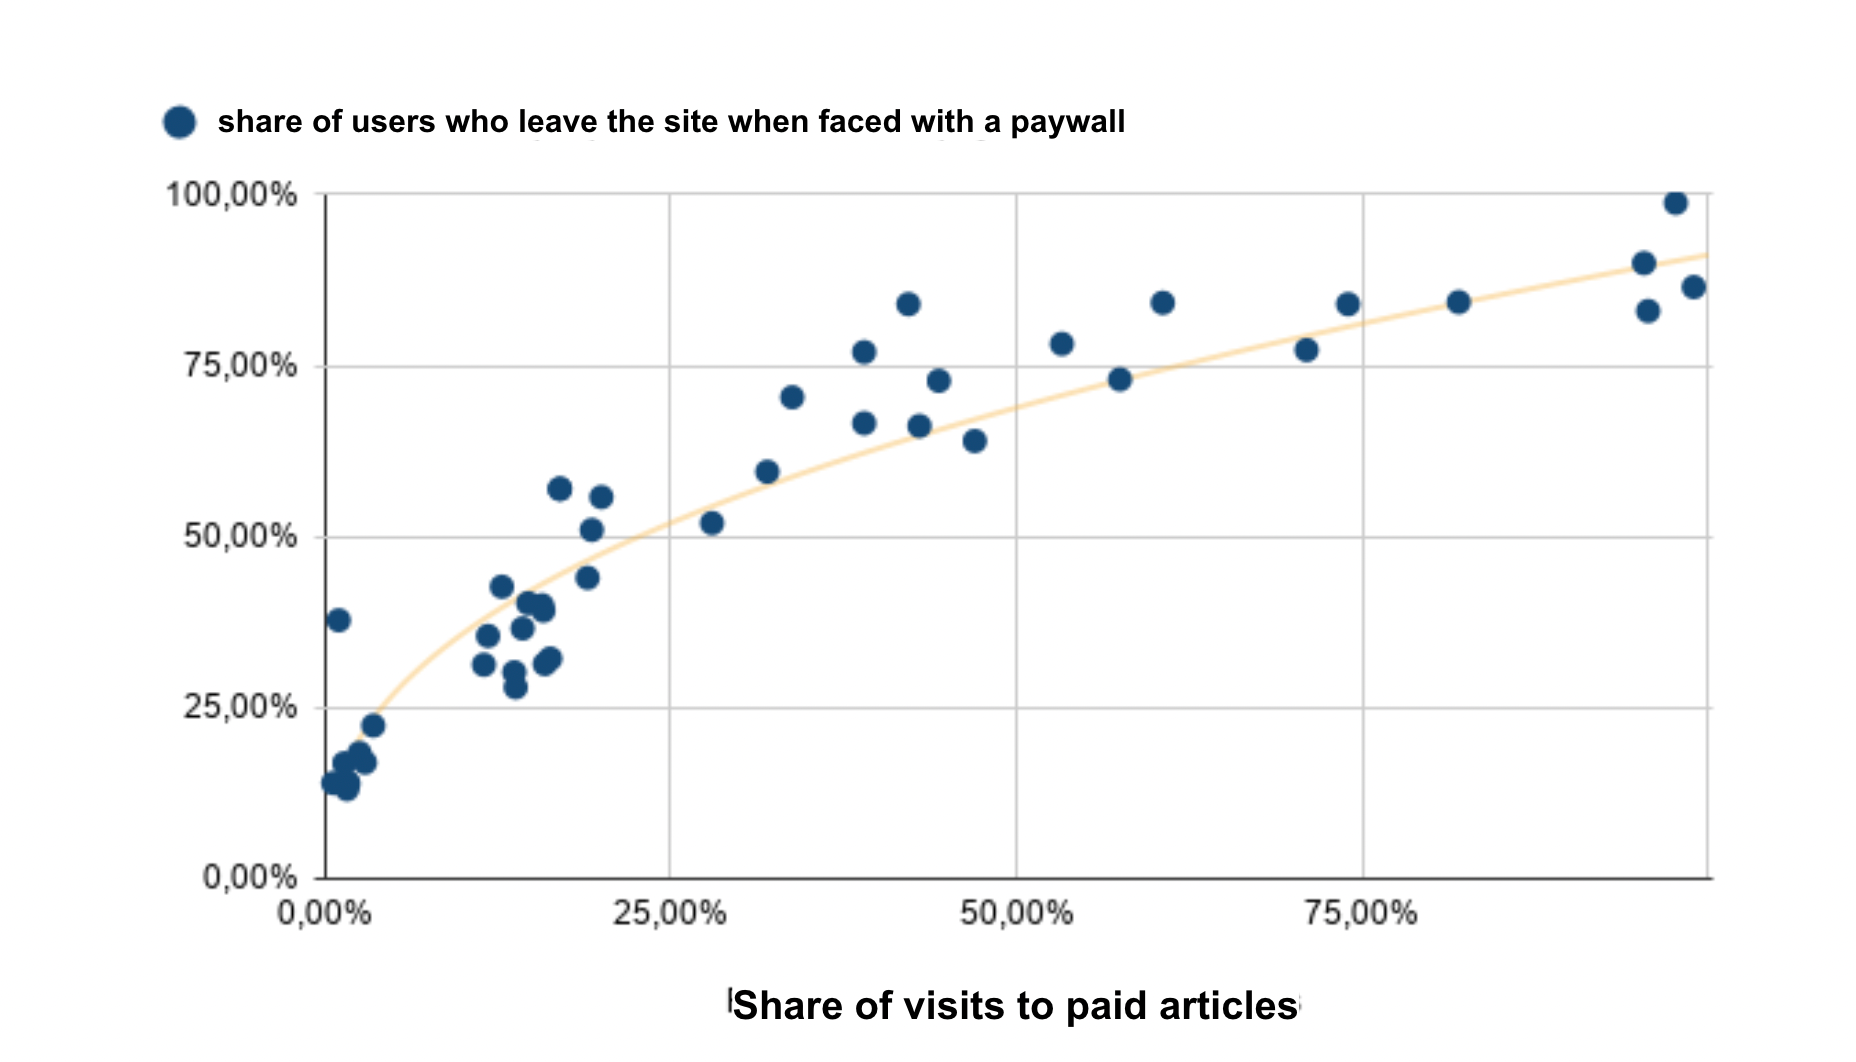
What’s more, if this link exists, then there must also be a correlation between the frustration created by increasing the visibility of paid content and the rate of departure from the site when a reader is faced with a paywall. We can argue then that frustration drives conversions whilst simultaneously encouraging readers to leave the site, which impacts engagement.
The question is, is this a problem?
Firstly, note that this indicator is hugely important. It links to reader engagement which ultimately means it’s connected to the entirety of publishers’ business models, including subscription, advertising revenues, events, services, etc.
Let’s look at some examples of this indicator in practice. ‘Mediapart’ (a French publisher), for example, had 90% of readers leave when faced with a paywall, meaning that if they can convert the majority of the other 10%, then despite this reader frustration, their conversion rate is still a success. However, with ‘Les Echos’ (another French publisher), multiple business models depended on reader engagement with the brand and content (publicity, events, etc.). This meant that adding a bit more frustration would have a positive impact on their online subscribers, but a negative impact on all other business models.
Given these examples, it’s important to follow and monitor this indicator closely, giving more or less importance based on your brand and strategy.
Our recommendations: Whatever your strategy is, when readers are faced with a paywall, you will always be aiming to optimize the number of clicks towards the subscription tunnel and reduce the number of people who leave your site. To help achieve this, we’ve put together a few examples of good practices to keep in mind:
1 - Measure indicators: This should be the first thing on your list! Without monitoring and continuously analysing the right indicators, you’ll never know whether something is having a positive or negative impact on your performance. We recommend that you follow 3 indicators: the traffic on paid content, the click-through rate on your paywall and the rate of departure from your site.
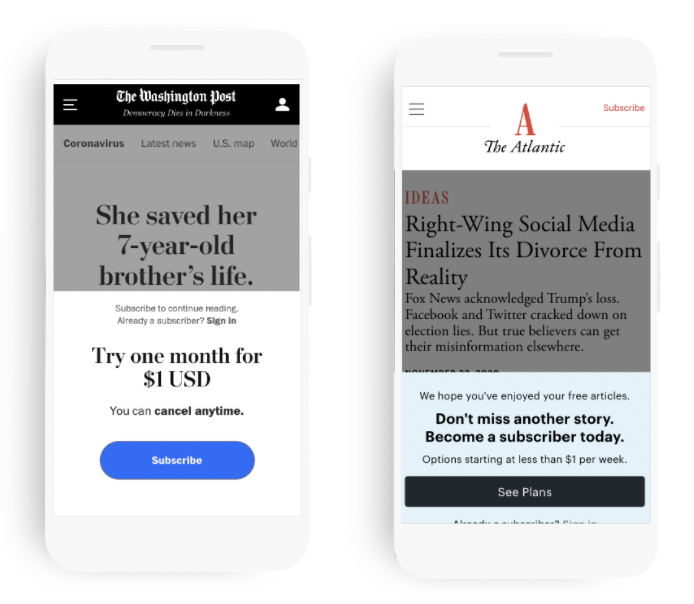
2 - Work on your paywall’s visibility rate: From analyzing our clients, we found that the average visibility rate sits between 30 and 60%. This means that 40 to 70% of readers don’t get presented with a paywall. If we take two extreme examples of The Washington Post and The Atlantic, they both opt for a paywall visibility rate of close to 100%. Because of this, they likely have a much higher click-through-rate on their paywall. However, this paywall design (an overlay style) doesn’t encourage recirculation and could impact the rate of departure from the site, but this is likely not in their business model. Therefore, the visibility rate on your website should be based around your own business model, ensuring a balance between conversion and other important factors to you.
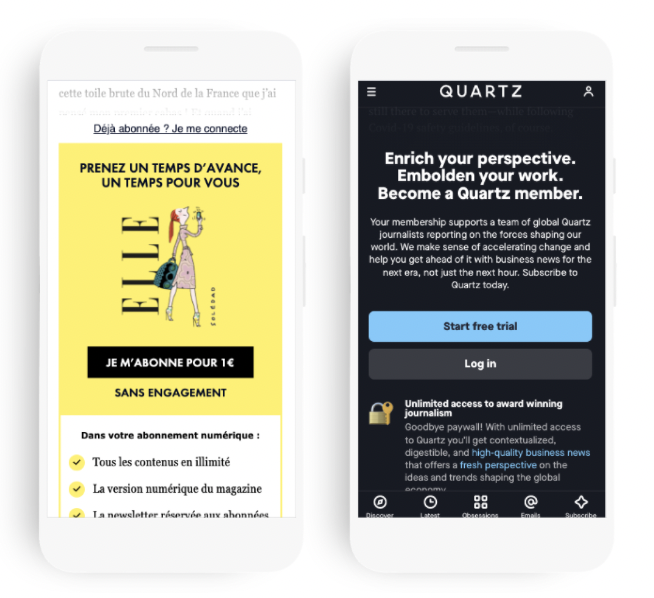
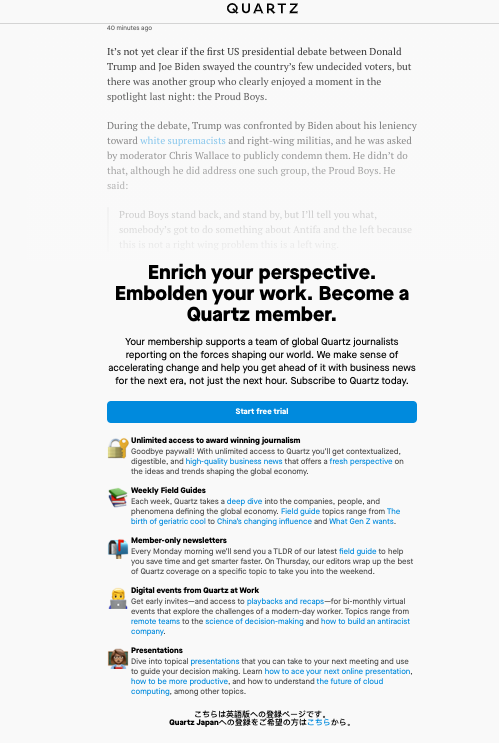
3 – Improve your paywall branding and UX: If your reader reaches the paywall, you now need to entice them to click-through and discover your subscription offers. At Poool, we’re convinced (through principle and experience) that design is hugely important in optimising click-through rates. Take a look at these examples from Quartz and Elle.fr which perfectly demonstrate this point.
NB: If you’re looking to optimize your paywall design in a simple but effective way, our paywall Poool Access is made for you! Try out our free demo.
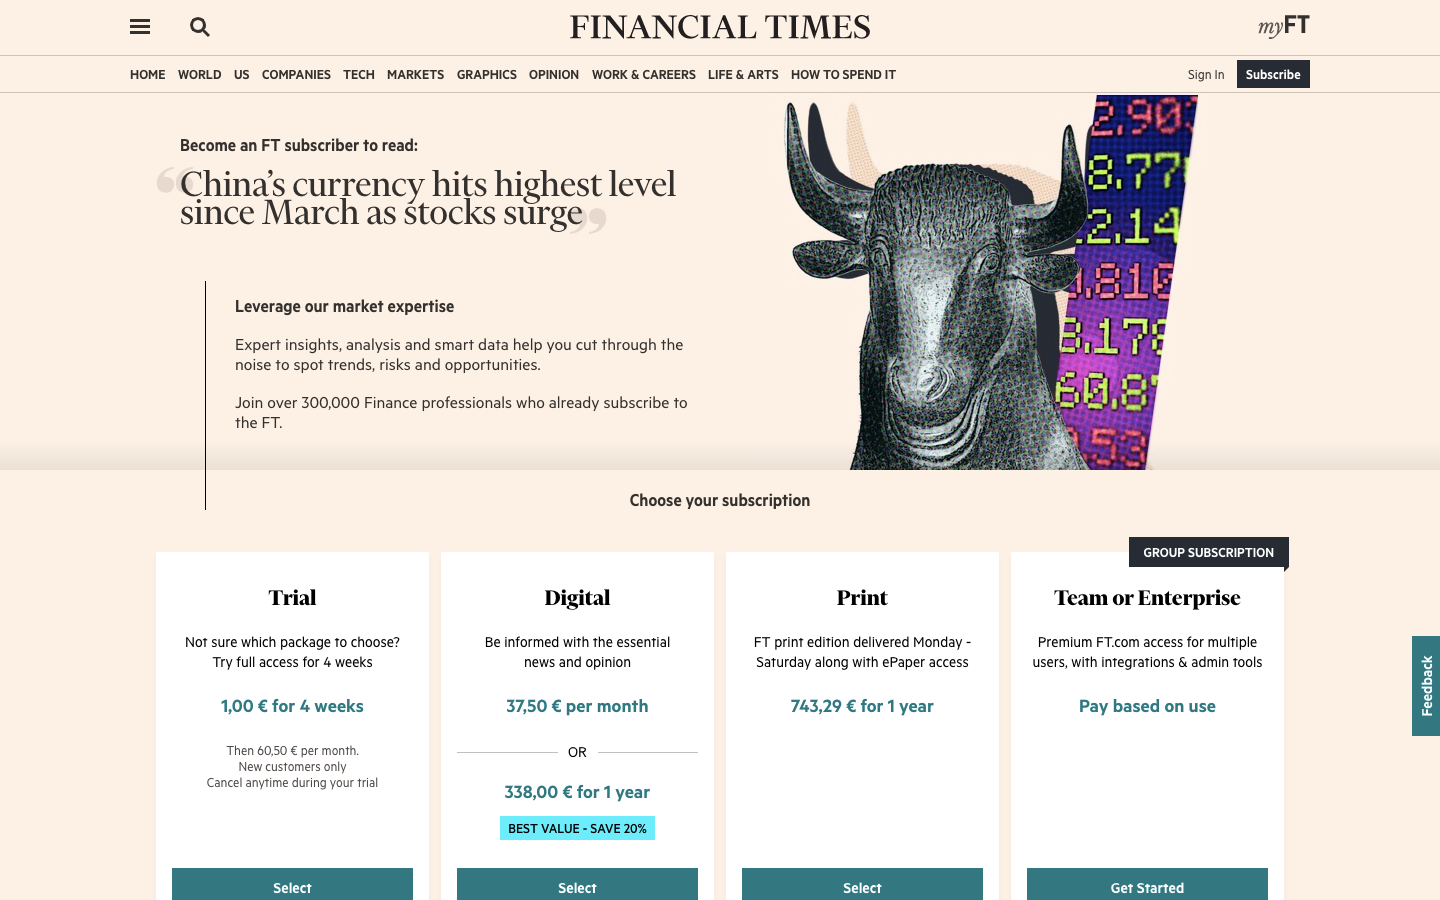
4 - Improve the content of your paywall and the value proposition: In order to get readers to click on a paywall, you need to entice them. Take time to work on the wording of your paywall as well as the value proposition. The Financial Times and Quartz are good examples here:
5 - Allow readers to explore your content and offers: Most of the time, publishers value this in their strategy and adapt content and offers based on a reader profile. And quite rightly so. When faced with your paywall, perhaps ‘volatile’ readers will leave your site, not yet convinced of your offer, whereas ‘fans’ will be more inclined to consider subscription offers and subscribe. Personalizing this access-to-content experience through the dynamic paywall allows you to work on both engagement and conversion simultaneously. You can find some examples of this on our blog and website.
If, though, your reader really doesn’t seem to want to subscribe nor click on your paywall, you should move to preventing them from leaving your site. The best way to achieve this is to work on which articles are recommended to them, including at the end of the article (below the paywall) and on the sidebar. Not addressing this will mean that the reader will only see the paywall and advertising. They won’t be satisfied with options presented to them and will likely leave your site. This, of course, has an impact on your engagement and on the entirety of your site’s business models.
Part 4: Choose KPIs wisely to manage strategies.
Spoiler alert: This section is pretty obvious…
Insight #6: There’s a correlation between the traffic on the subscription page and conversions (duh).
Our analysis: So, traffic in the subscription tunnel is directly related to conversions, and the more traffic we have in the subscription tunnel, the more conversions. But did we really need the Digital Media Review to find this out? Not really. However, having data which verifies this allows us to support this conclusion, but also helps us to solve a common problem among marketers.
Let’s have a look...
When you do an A/B test with ‘optimizing conversions’ as the variable, you’ll need a great deal of data to prove that test A is better/worse than B. The problem is, however, that very few publishers have enough new subscribers per month to make this test effective. This means that they’ll have to leave it running for a long period of time to get sufficient data.
The useful trick here is that, as we know, there’s a correlation between traffic in the subscription tunnel and conversion, so we can use one indicator to help provide data for the other. Useful, no?
Our recommendation: It’s easy. When sorting successful strategies form the unsuccessful, track traffic in your subscription tunnel as a secondary metric.
NB: If you’re unsure of the best indicators to follow to successfully manage your subscription strategy online, take a look at our white paper - 'Which KPIs Should You Follow to Manage Engagement and Conversion Strategies?'.
PART 5: There’s a large gap between conversions on mobile compared to desktop.
For all e-commerce, there’s a big difference between conversion rates on mobiles and on desktops. There are multiple explanations for this: their use, the payment method, user experience, etc. It’s usually the case that, in terms of e-commerce and the rate of conversion, desktop is two times more successful than mobile (even if these disparities in conversion rates are starting to ease out over recent years). Insight #7 shows us that this is indeed the case among publishers too.
Insight #7: Conversions are (a lot) higher on desktop than on mobile.
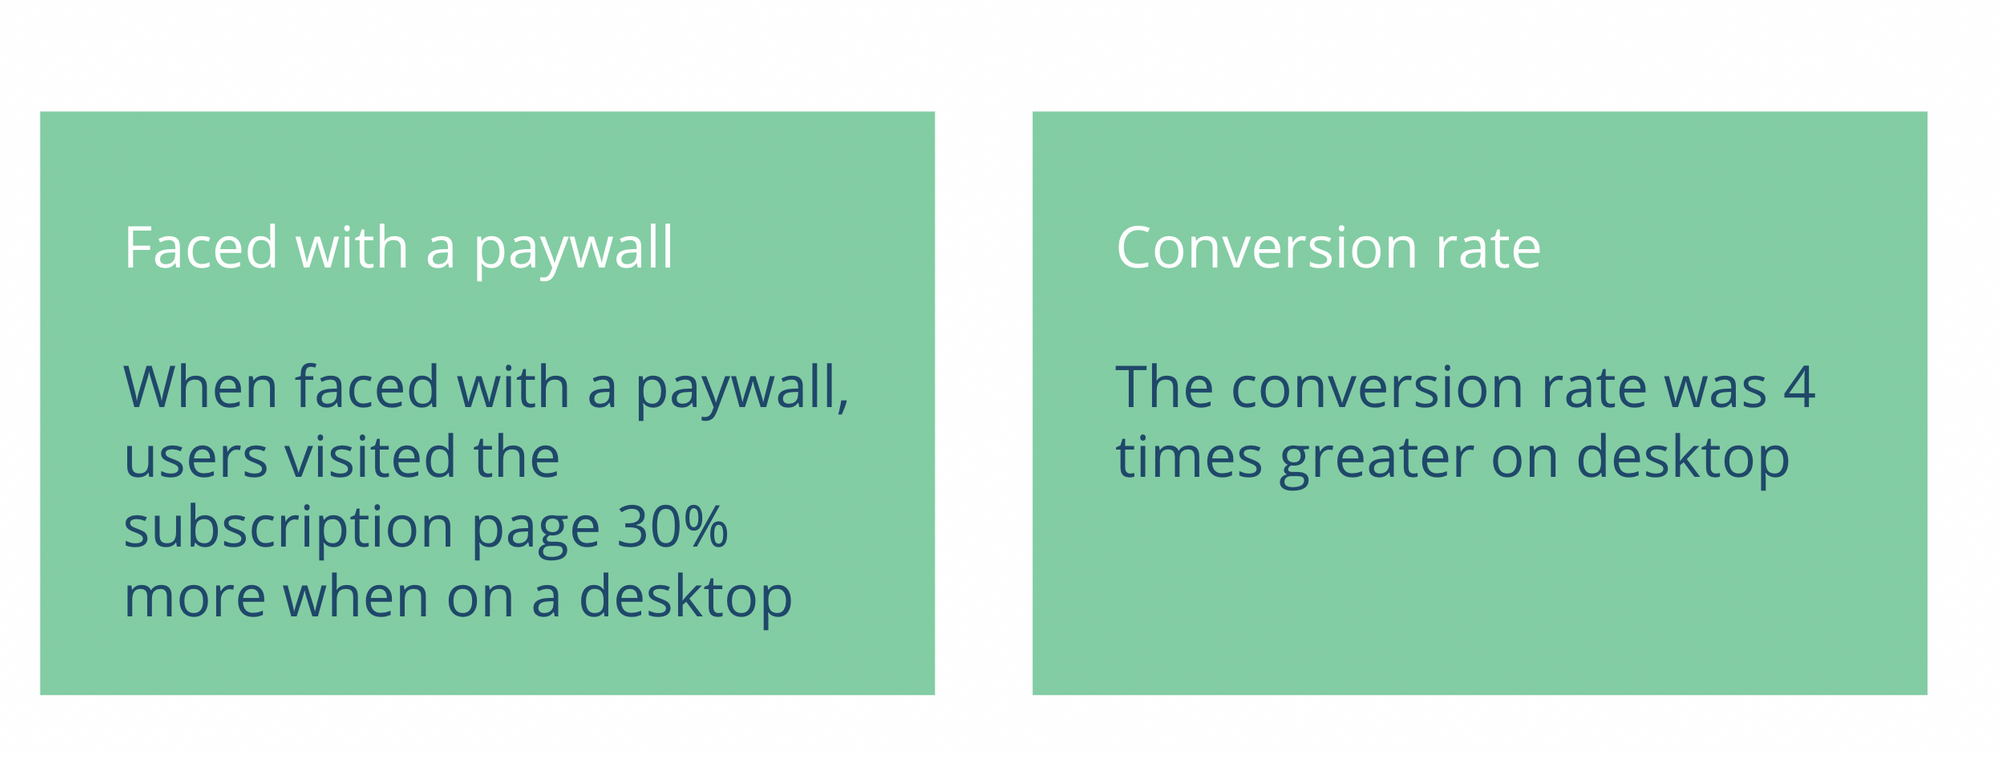
Our analysis: Even if readers are consuming articles more on their mobiles than ever before, the Digital Media Review has shown us that the conversion rates are on average 4 times higher on desktops. It important to keep in mind then that the large majority of conversions take place on a desktop, despite the incredible increase in mobile usage.
So why is this? We can put it down to two reasons:
- Firstly, online purchases are mainly done on a desktop. Although mobile payments are increasing, the target audience of publishers is, in general, of an older age group than an e-commerce audience. This age difference could also explain the disparities of conversion rates on mobile devices vs desktop between the press and e-commerce.
- Secondly, linked to above, simplified payment methods and conversion journeys are actually still fairly rare. There’s quite a bit more that can be done to facilitate the reader experience as well as encourage mobile conversions, meaning that a desktop is still the easiest device for a reader to use to convert.
Our recommendations: To optimize your conversion rates on mobile devices, we have 3 recommendations for you.
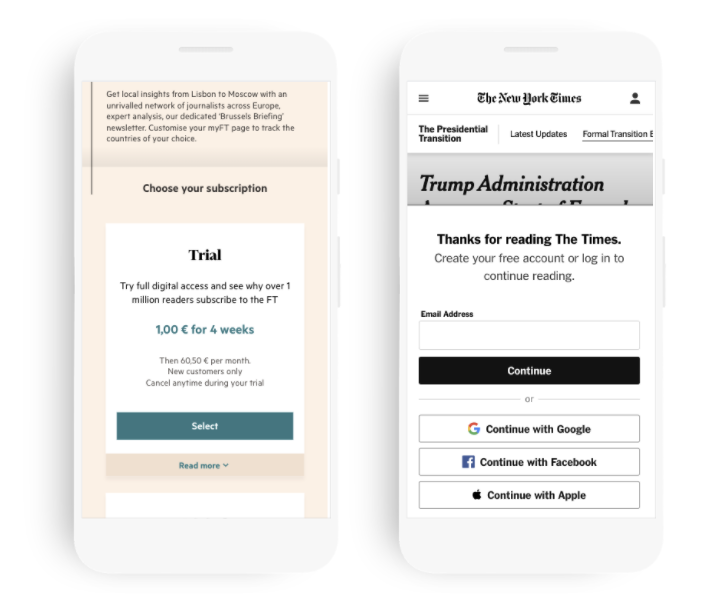
1 - Limit the number of steps: To optimize conversion, reduce the number of steps that a reader needs to go through. We can see this in action with the Financial Times and the New York Times. The Financial Times has subscription offers directly on the paywall which cuts out a step in the process and instead sends them straight to the form. The New York Times goes further and puts the form on the paywall itself, with an integrated sign-in section.
2 - Ensure that the payment process is simple: Make it easy for the reader to pay you. Apple pay on an apple device? Google Pay for Android? There are endless options nowadays. Think about simplicity, but also reassurance, as users like payment methods (such as PayPal) which are well recognized and reliable.
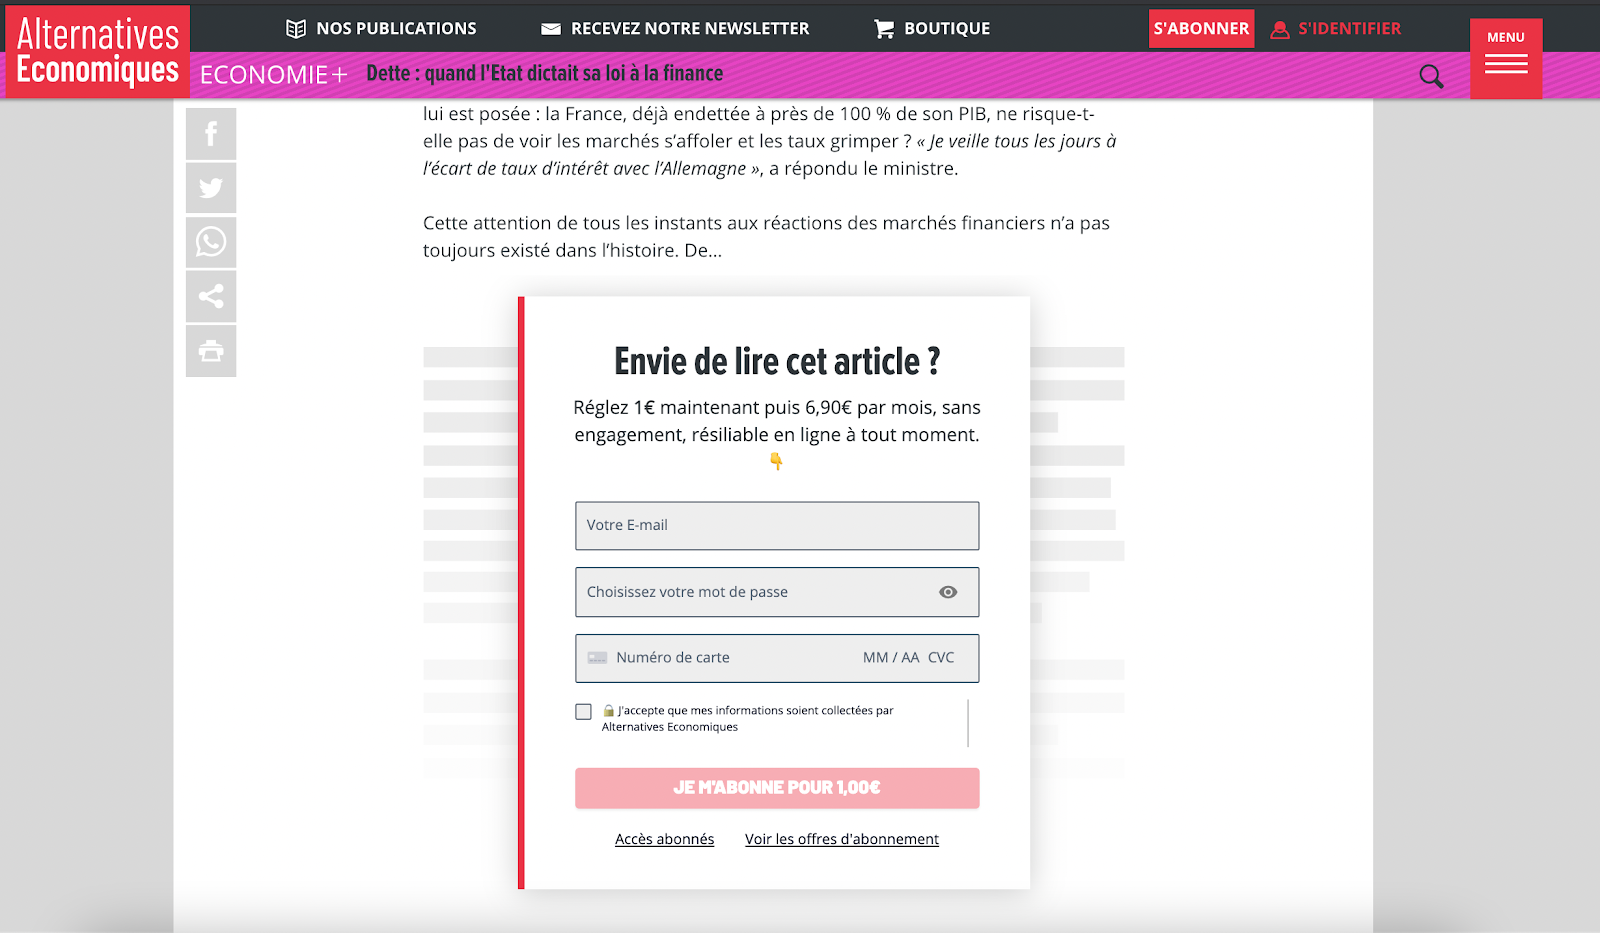
3 - Put all or a part of the subscription process on the article itself: The New York Times, for instance, integrates account creation within the article, shortening the conversion process. Some publishers go further however, such as Alternatives Economiques in France, who have the entire payment process in a single click inside the paywall itself.
NB: If this format of paywall interests you, contact us for more information!
PART 6: Large differences in conversion rate across different types of press.
Not all types of press have the same level of maturity when it comes to online subscriptions. We can place them into two categories based on this metric, as shown by insight 8.
Insight #8: Disparities exist between different types of publishers based on maturity and results (categorized from here as professional’s vs the majority of bench-markers).
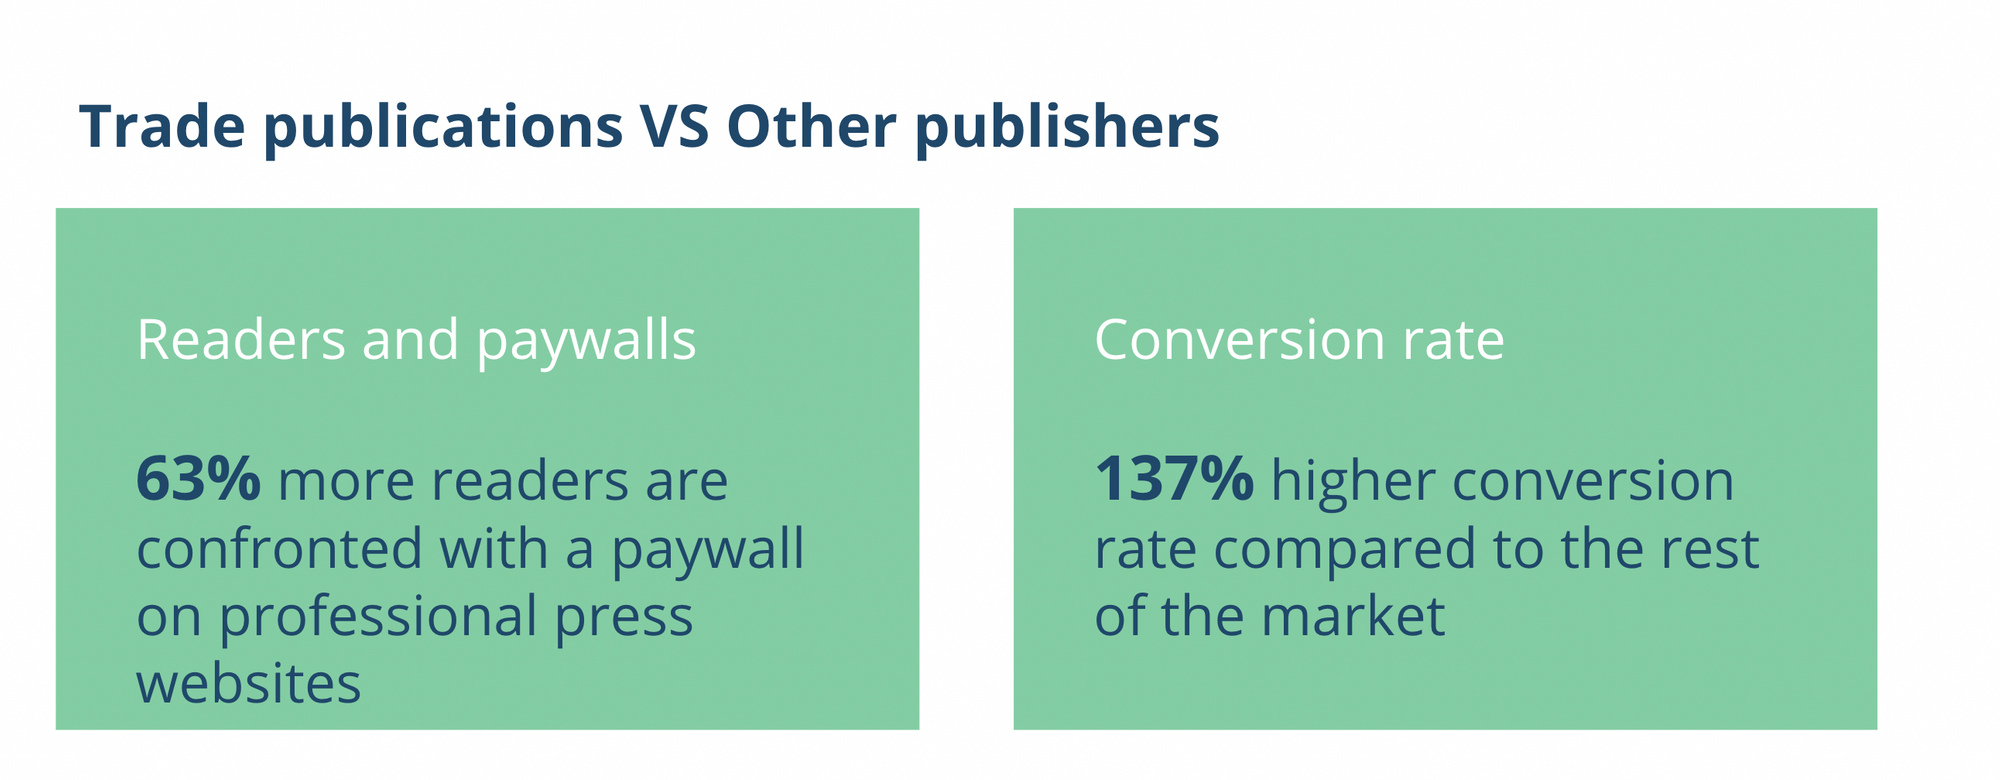
Our analysis: Not all press companies are at the same level when it comes to online subscriptions. This can be seen pretty clearly in the data. Traffic on content for professionals is considerably higher (more than 60% more), which means that more of their readers are exposed to a paywall (+63%).
Professional press also gains greater results on their conversion rate towards subscription (+137%). This can be attributed to multiple factors:
- Payment models in professional press were employed far before other types of press (such as magazines[1] [2] , daily regional/national publishers….) so readers have now got used to paying for content from their site. (This is slowly starting to change in B2C press after 20 years of practically completely free internet browsing.)
- The value of paid information from ‘professionals’ in the press has barely been questioned, especially compared to other online press.
- More value given to professional press means it's perhaps easier to charge readers for their content, whereas the value of other types of press is questioned a lot more. This isn’t helped by the fact that it has become normal to access other types of press content for free online.
Our recommendations: Before trying to convert readers into subscribers, speak to them. Help them to understand your mission, gain interest and hopefully appreciate the value of a pay-for-information model. This won’t just prove useful to you but to the entire online press industry.
To conclude, insights 9 & 10
To conclude this webinar write-up, we wanted to leave you with what we consider as the 2 most important insights of the Digital Media Review.
Insight #9: For readers, COVID has revealed the value proposition of online publishers.
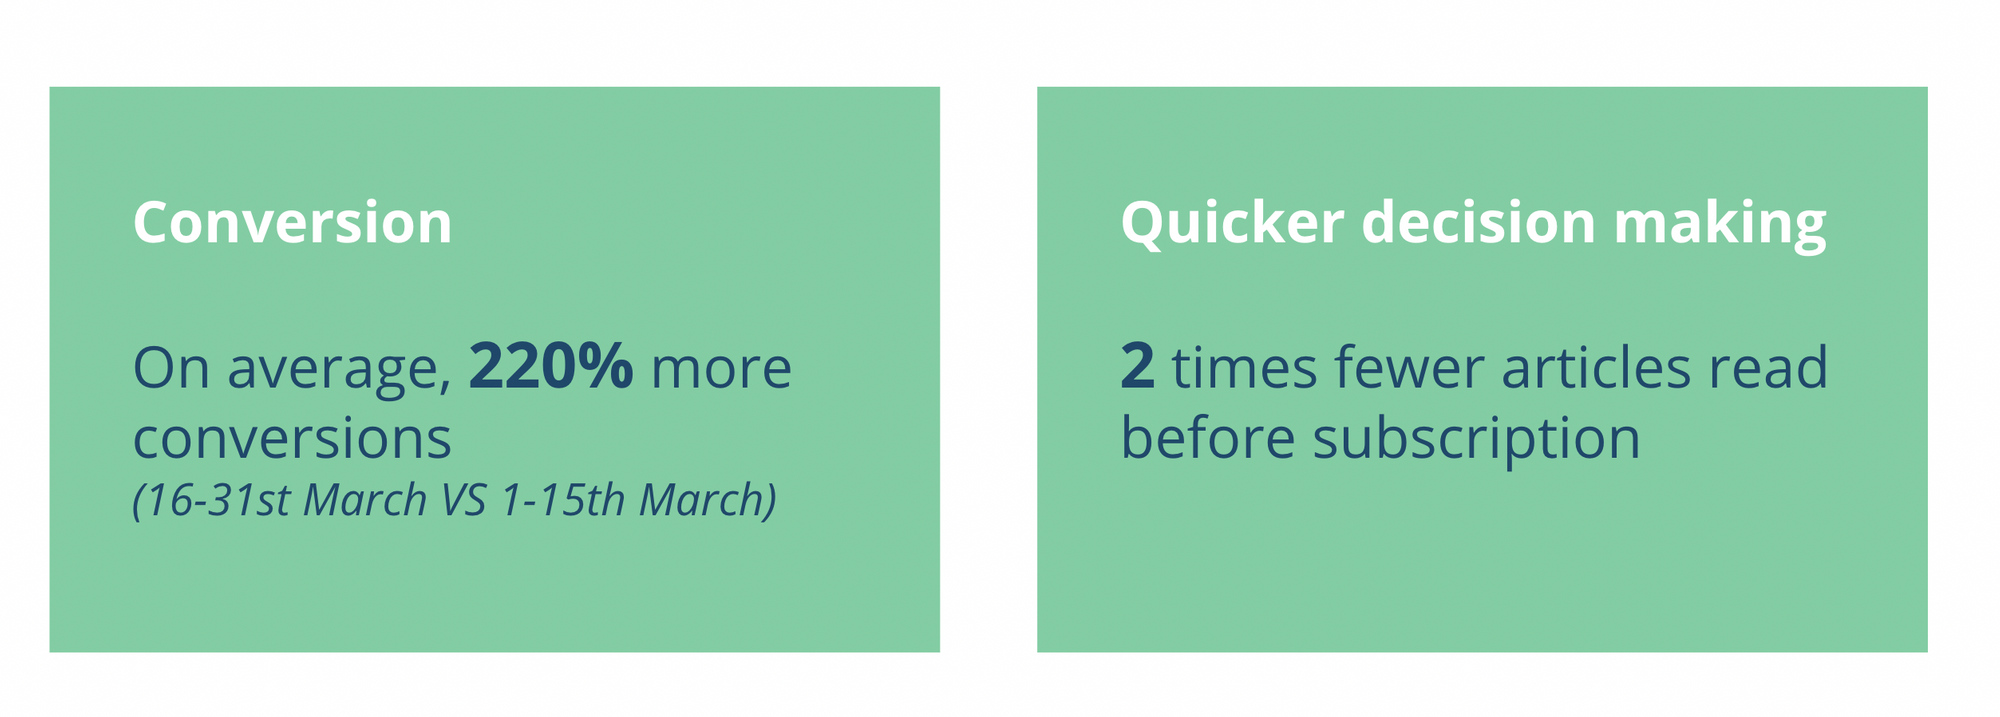
We need not remind you of the start of the pandemic, in March 2020, when the world was full of incertitude and misinformation, where all we needed was reliability, clarity and, let’s face it, an end to the lockdowns. For online publishers, however, this worldwide situation gave them value in their users’ eyes, without them having to change any part of their strategy.
This is clear in the data. More conversions and, importantly, readers are taking a shorter period of time before subscribing. As we’ve seen, frustration plays a pivotal role in the conversion process. For us though, the factor with the greatest impact on conversion is the value proposition and by extension, the content.
Insight #10: Don’t take anything as a given.
This is an important point for us, linked to observations over the years, with both our clients and the Digital Media Review. In order to perform successfully in acquiring subscribers online, you need to try, test, fail and adapt. You won’t find the perfect formula to convert readers into subscribers with benchmarks. Instead, you’ll find it within YOUR OWN users. So, forget what you’ve learnt about this benchmark, have confidence, and go test things. Find the best formula to suit you.