

To wrap it up:
- Measuring the performance of your content and value proposition are the foundation KPIs for any reader revenue strategy
- Many often forget about tracking the visibility of their subscription offer
- User engagement and conversion KPIs are of course essential
- As well as churn metrics that allow you to increase retention rates and maximize the life-time value of your subscribers
Historically, most digital publishers were surviving off advertising revenue to monetize the production of their content. However, this model no longer provides a sustainable, reliable revenue stream...
- Most of this ad monetization potential has been captured by monopolizing platforms such as Facebook and Google
- More than 35% of readers use ad-blockers
- Up to 80% of traffic is now on mobiles, putting added pressure on advertising inventories and revenue
- Click through rate on ads is now at an average of 0.05%
- Cookie consent rates are falling whilst third-party cookies are on their way out
To overcome this threat to revenue, publishers are moving over to a diversified monetization strategy, with subscriptions leading the way as the most popular, reliable and predictable revenue stream.
Switching from an ad-model to a subscription model is a significant change for media. It means moving away from the past few decades of analyzing digital performance based on impressions, audience size and visibility of articles to subscription strategies building relationships with users, studying their engagement and loyalty. The change also affects the organization as a whole, even up to the employee incentives which were often based on these volume indicators.
Unfortunately, as we're all too familiar with, there's no magic formula or perfect example to follow that can be used by all publishers to successfully develop a digital subscription model. It may be true that The New York Times paywall strategy allowed them to reach 50k online subscribers in just 2 years, but copying them may not bring about the same results. Each content producer has its own history, audience, brand, content and objectives meaning that strategies and models need to be unique to each publisher. Therefore, in order to manage your digital subscribers acquisition strategy, you'll have to measure, understand and adjust your own recipe for success.
In concrete terms, what's this guide for?
This guide results from our experience with more than 120 publishers who were faced with the same questions and issues as you. We therefore aim to provide you with the tools to manage your engagement and acquisition performance. You won’t find THE answer here, but key notions to measure, understand and manage relationships with your readers.
1. Content – a core element of value proposition
Value proposition is at the heart of the development of your digital subscription strategy. For a reader, access to information isn’t a value that’s satisfactory enough. If the value proposition of a publication isn’t clearly set out, then why would a reader engage with this publication and pay to subscribe to its content?
The core of value proposition lies in content. Every bit of content on your website must fulfill a set aim - from the first content they access to the last click conversion. A reader doesn’t subscribe on their first visit (without churn), it’s a whole process.
- Acquire and attract users
- Engage them with your content
- Convert users into subscribers
- Reduce churn and maximize Life-Time Value (LTV)
Here’s our selection of indicators on measuring the performance of content:
Indicator A - Articles that generate (new) traffic:
- Which articles generate the most page views?
- Which articles or sections attract new users?
Note: Once a major indicator, this indicator is currently being overlooked by some publishers who take preference for other indicators introduced below. Yet, this indicator remains essential - each publisher must attract new users and generate traffic, because that’s where you establish the foundations of the engagement funnel.
Indicator B - Articles leading to engagement:
- Which articles or sections generate the most engagement?
- Which articles are mostly read by returning visitors?
- Which articles generate the most time spent on the website?
- Which articles generate returning visitors?
Note: the concept of engagement is unique to each publisher. For some, the time spent will be important. For others, the frequency of visit will be essential. But, most importantly, think about what your readers look for when they browse your website – enjoyment? learning? to get information? The concept of engagement is directly linked to that.
You can also measure engagement score, a RFV segmentation (recency, frequency and volume). This was historically used primarily in e-commerce but has since been adapted and put in practice in all sectors in which the behavior of clients can be measured, including in the media industry. Discover more about this metric in our North Star KPI article:
 Madeleine White
Indicator C - Articles leading to purchasing behaviors
- Which articles or sections generate most last click conversions?
- Which articles or sections generate most conversions in the last session before subscribing?
- Which articles generate purchasing behaviors from readers such as visiting the online shop, unlocking an article, taking a free discovery pass?
Indicator D - Articles mostly read by subscribers
- Which articles are mostly read by subscribers?
- On which articles do subscribers spend more time?
- Which articles generate most engagement for your subscribers?
All of these indicators will allow you to understand the role and value of each piece of content and what role they play in your business model, be it for the subscription or for other sources of revenue.
2. Visibility of the subscription offer via paid content
A value proposition clearly set out, a strong brand and engaged audience doesn't necessarily mean a successful digital subscription. One of the indicators to take into account at this stage is visibility and clarity of subscription offer.
Content being at the core of the product, readers must understand and realize in concrete terms what it means to subscribe to your publication (even though it’s also a subjective and subconscious process). For a media, enhancing the visibility of offers means showcasing premium articles (on the home page, on the recommended content section, etc) AND ensuring readers see the paywall that blocks this subscriber-only content.
Why is the visibility of content essential to the subscription process and stick rate?
- It allows subscribers to understand why they are subscribed and should remain so. This will impact churn control - that is to say the ability of publishers to win their readers’ loyalty in the long-term
- It enables non-subscribed readers to visualize the reasons to subscribe
- The more a reader is confronted with a paywall, the more they’ll get used to seeing your message(s), and so your value proposition which sets out a clear reason to subscribe
Here’s our selection of indicators concerning the visibility of subscription offers.
Indicator A - Visibility of paid content
- Which articles are read the lost by your readers: premium articles? Free articles?
- Is your paid offer highlighted enough?
Note: Working alongside 120 publishers, we noticed that, naturally, there's a direct correlation between the % of traffic on paid content and subscriptions. It’s also completely doable to increase the visibility of paid content without having to increase the number of articles available. For instance, you could highlight paid articles on the home page, in newsletters and in the recommended search.
Indicator B - The behavior of your readers regarding this paid offer
How do your readers react to blocked paid content?
- Do they leave your website?
- Do they browse the page presenting subscription offers?
- Do they go to another page?
Note: With this indicator, you'll be able to measure whether the paywall pressure has an impact on your reader's behavior as well as the attractiveness of your subscription offer.
Indicator C - Does the correlation between '% traffic to paid content vs total PVs' and subscription apply to me?
It’s not because we think it does that it necessarily applies to you! Just measure it and see it for yourself.
3. Audience engagement
Your brand is clearly defined, you have a strong audience, your value proposition is set, and your paid content offer is highlighted to users. There’s still an element missing to create the base of a successful business model: engagement.
For the subscription business model, the concept of user engagement will be essential. Once again, measuring engagement will be specific to each publisher and to what publishers have already noticed. For some, the switching point from a volatile to an engaged user is more linked to frequency, for others it's connected to the depth of the visit itself.
Here’s our selection of indicators regarding user engagement.
Indicator A - Measuring user engagement on devices
- On which devices are users most engaged? Mobile, desktop, apps?
- How does the engagement rate evolve on each of these devices?
Indicator B - Measuring engagement rate broken down by reader-type
- How are users divided up according to the frequency of visit?
- How does each of these segments evolve over time?
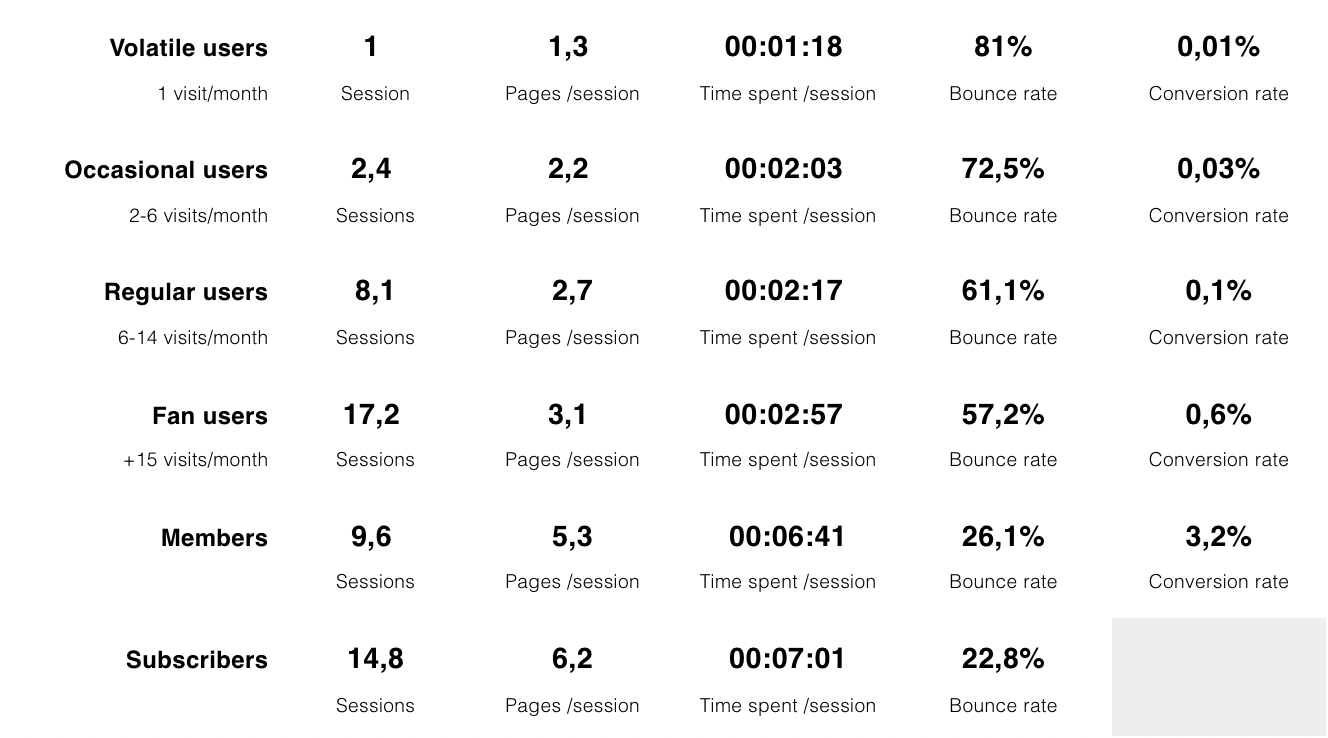
Note 2: This indicator is particularly relevant over a large period of time to measure how groups of users evolve from one month to the next. If you can correlate this indicator to your marketing campaigns to understand what can make a user move from one group to another then it’s even more relevant.
Indicator C - Measuring the engagement rate due to content type
- Which content creates the most engagement?
- Is this content aligned with the value proposition and content strategy?
- If not, what content or sections must be prioritized? (Content, highlights…)
Indicator D - Engagement behavior and conversion
- In a general manner, is there a link between conversion and engagement?
- Is there, for instance, a link between frequency of visit and conversion?
- Is there, for instance, a link between the time spent on a website and conversion?
- What’s the average time in days between the first browse of the website and conversion?
Note: The aim here is to find out the tipping point, that is to say the moment where a number of small, successive behavioral changes become important enough to create an even more significant change (in this example, subscription). Some publishers have, for instance, realized that 90% of conversions came from readers who browsed their website more than 10 times a month. In this example, a publisher can adapt the engagement and conversion strategy according to the frequency of visits.
Indicator E - Weak signals (*see below) and conversion
- Is there a link between the subscription to your newsletter and conversion?
- Is there a link between the creation of an account and conversion?
- Is there a link between commenting and conversion?
- Is a visitor who did any of the above more likely to convert than an anonymous reader?
*Note: a subscriber will generally go through different steps of engagement with your brand before converting, that’s what we mean with 'weak signals'. If you notice a correlation between weak signals and conversion, then you’ll be able to understand the ways in which to optimize conversion. Thus, you can set intermediary goals to reach and not solely concentrate on the final aim of subscription.
4 – Subscription and engagement funnel
Your value proposition is set out, your content matches this value proposition and your offer is visible for your readers who are increasingly engaged with your website. In theory, it’s all good. In practice, however, you must pay attention to how your readers behave, not only through the subscription funnel, but all the way through their life cycle on your website.
Indicator A
- How many readers on your website are exposed to your paywall at least once a month?
- Is the paywall visible on the reader’s screen?
Indicator B
- How many readers come across the subscription offer page at least once a month?
Indicator C
- How many readers convert for each step of the subscription funnel?
Note: this section of indicators will be useful to understand how most readers behave on your website. Most of all, however, this will help you to understand where you can find the greatest potential to develop digital subscriptions. You may well have the world's best subscription offer and conversion funnel, but if no reader is confronted with your paywall, it won’t succeed. And vice versa. You’ll have to follow how these ratios evolve over time and correlate them to changes that will be implemented in your strategies and on your digital devices.
Also, whilst measuring the engagement funnel to measure conversion remains important, measuring the engagement funnel also applies to other aims such as generating new registered users and increasing ARPU of non-subscribed readers.
5 - Bonus: controlling churn and stick
Minimizing churn and maximizing the average value of a subscriber are two big challenges that await media in the next five years. This said, it’s already a central issue for numerous publishers that have recently launched their digital subscriptions.
For the media industry, the digital subscription model is rather new. For many other industries though, who base their business model on subscription (be it on B2B or B2C), stick has been a significant challenge for years. So, the good news is that many people have already worked on churn, and more precisely on how it can be anticipated and mitigated.
Here’s our own section on churn and how it can be anticipated. There are hundreds available, so make up your own mind!
For more information, we also have another article on how publishers can minimize churn risks.
Step 1 – Measure and follow engagement level
- See part one to understand how to measure the level of subscriber engagement. This indicator will enable you to adapt your content according to the value they have for subscribers.
- See part three to measure how subscriber engagement evolves and thus learn how to correct this evolution if you're noticing a significant increase in churn. Measuring a user's engagement level is most important during their first month as a subscriber to your site, perhaps even more so during the first 15 days. This is a key stage where your customers will become aware (or unaware) of the value of their subscription. Hence the importance of managing the onboarding well.
Step 2 – Spot the weak signals generating churn
There are many examples of weak signals, and some have been highlighted by American publishers such as Newsday and The Columbus Dispatch during a webinar organized by the Newspaper Association of America (now News Media Alliance). These publishers noticed that a change in payment method or delay in payment very often correlate with a future churn. Many other elements can be interpreted depending on the publisher (reduction in time spent on your site, decrease in open rate of newsletters and so forth). See more in this article on reducing churn risk.
Step 3 – Predict churn and employ preventative measures
If we go back to the same example as above, Newsday reduced churn and increased the LTV of its subscribers by setting personalized automated messages (on both an online and offline channel). Sending a gift to subscribers who have the highest risk of churn, such as a thank you card or product, proved to be a successful way to reduce churn. Suggesting to test a product (upsell) for free (such as a magazine trial) was another example of a way to reduce churn when readers seemed very likely to unsubscribe. You can also choose to do this beforehand as preventive measures. For instance, product testing or free ‘upsell’ has proved successful when aimed at new subscribers in their first six months, increasing reader’s loyalty and lifespan.
The advantage of being a digital publisher is that you can offer products or upsells to readers who seem close to churning without risking lost money (but with plenty to gain).
Conclusion
In terms of performance measurement, the subscription business model completely differs from the advertising-based model. Publishers are required to go from measuring volume to focussing on engagement and relationship marketing.
As we've seen throughout this guide, the measurement indicators vary. We've highlighted five branches of key indicators: value proposition analysis, measuring subscription offer visibility, user engagement, their lifecycle during the acquisition and stick phase.
This is a radical change in paradigms for publishers. It's more than just a change in performance indicators to follow, it also means that you must:
- Hold a reliable tool of measurement that is successfully integrated
- Have a team that has enough time to measure and analyze these indicators
- Have a team who has the necessary skills to understand these indicators
- Have enough resources to put corrective actions into practice
And, on a larger scope:
- The departments within your company should be interdependent to encourage exchanges between different departments (content, marketing, technical…)
- You should share common targets between your company's different departments
- And naturally you should incentivize each of your employees according to how these common targets have been reached instead of reaching targets that are opposed to one another
As you have understood, this guide doesn’t provide universal answers but a base, a marker with which each publisher can position itself and adapt its performance analysis according to its brand, history, audience, value proposition and goals.
So, now it's over to you!
Interested in launching a registration or subscription strategy with ease? Let's book you in for a free demo!
Other content you might like:
Maxime Moné Madeleine White
 Madeleine White