

Page views, bounce rates, unique visitors, oh my!
With so many potential KPIs out there to track, how can you be sure of which metrics will have the greatest impact on your business?
There are definitely some that are more important to track than others and it’s well understood that choosing a single, north star KPI is vital for aligning the newsroom in working towards a shared goal.
“Defining a single, shared objective across an organization is one of the most powerful tools to align resources and accelerate growth” - FT’s Report ‘Towards your north star’
That’s why Poool are here to share their most essential KPI that every content producer should be tracking and seeking to improve.
Namely, engagement.
Regardless of the business model, user engagement correlates with conversion and retention rates, both of which have a direct impact on your revenues. So, by increasing engagement, you’ll be able to better monetize your audience and develop strong, lasting relationships with your users.
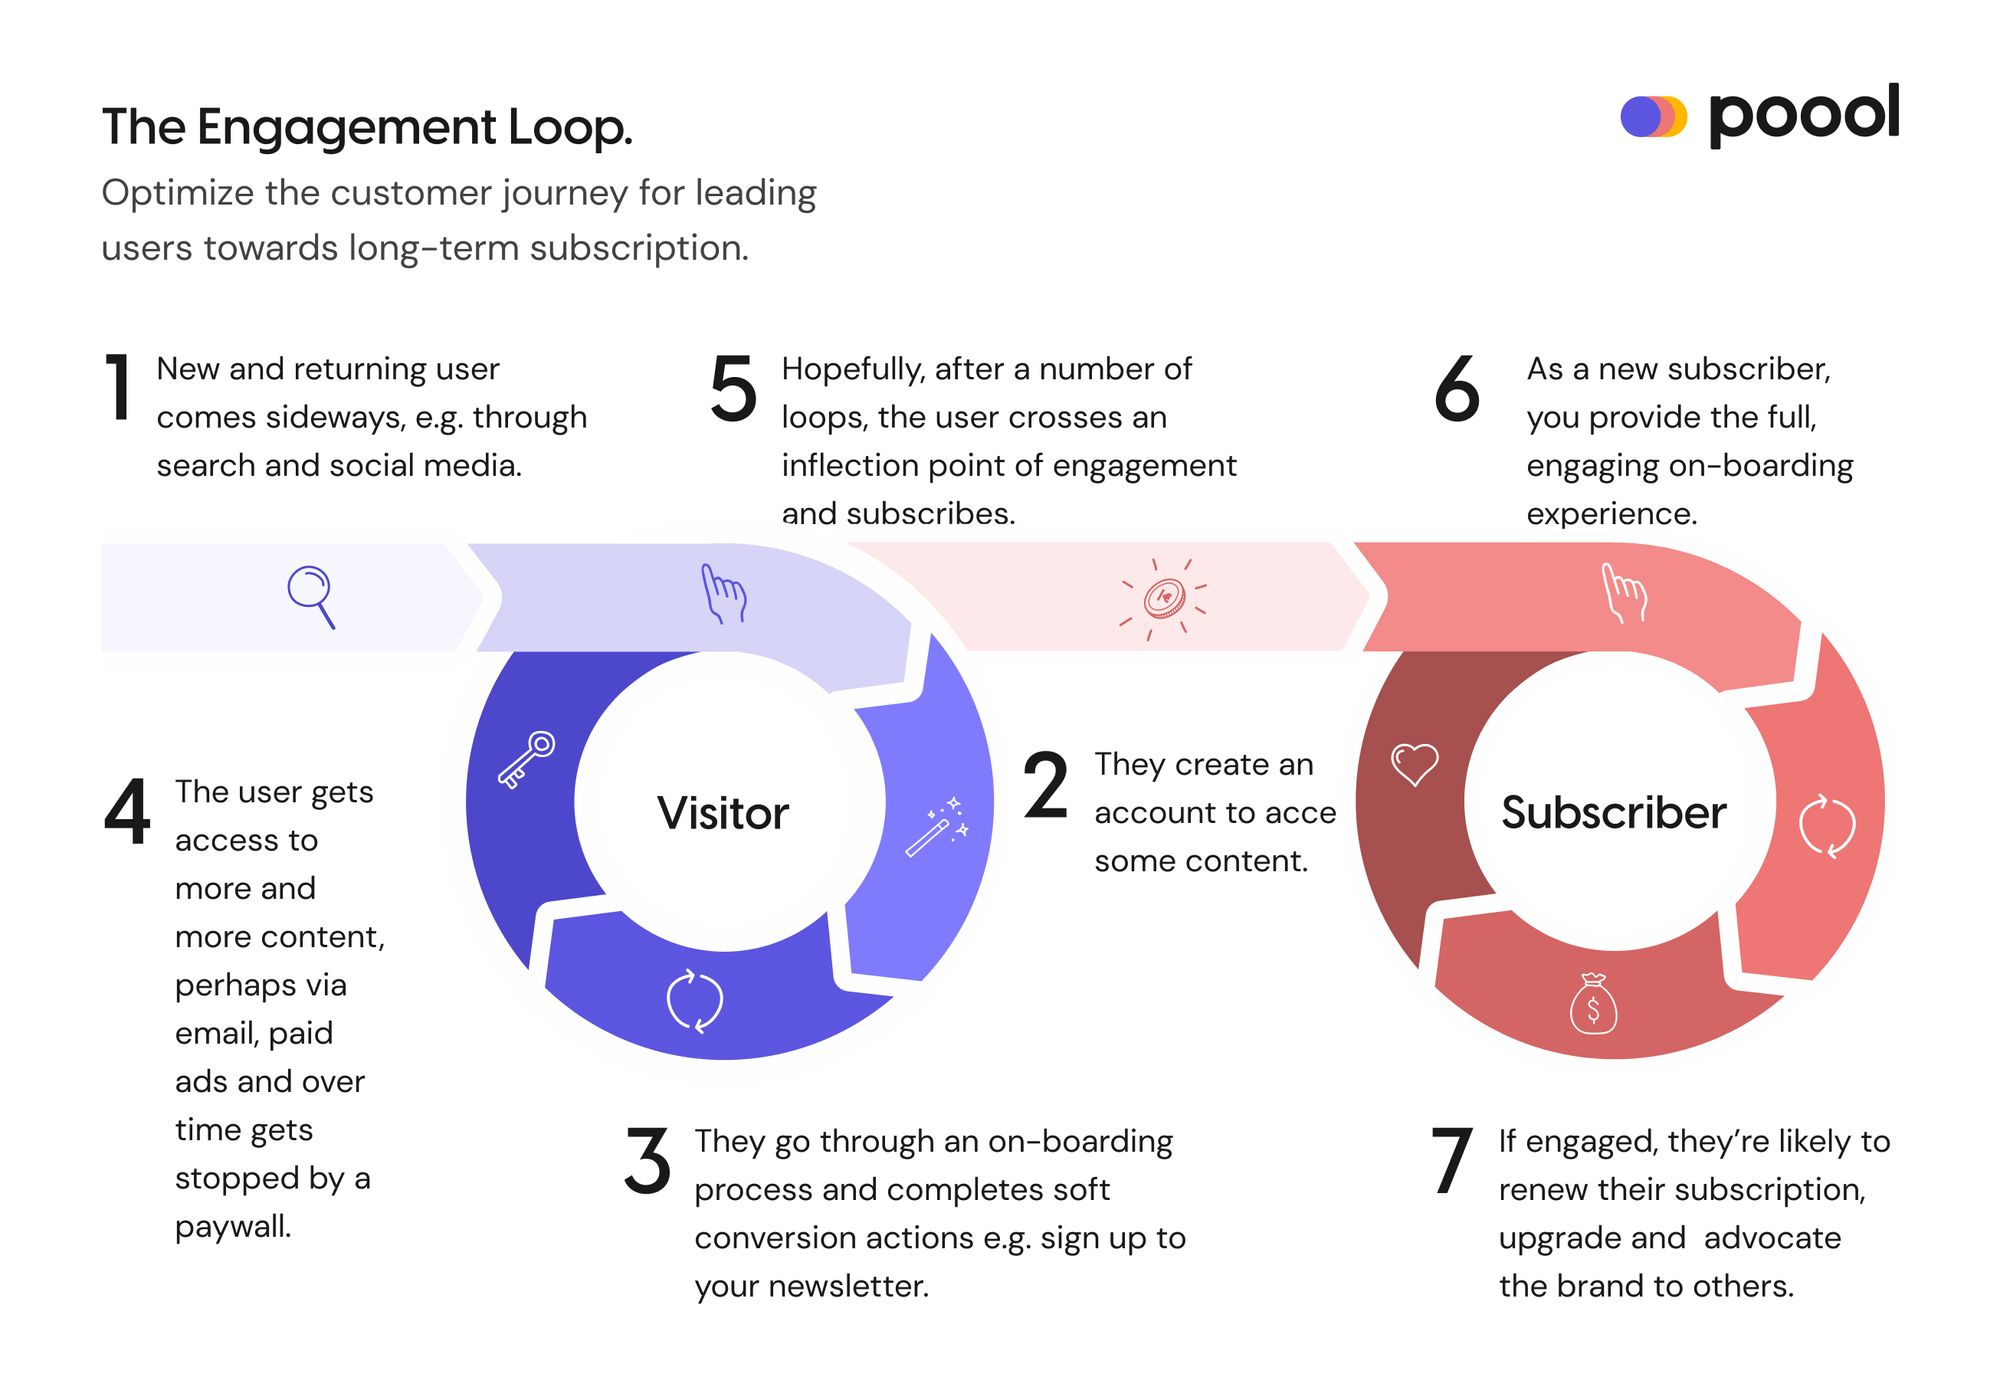
What’s more, it’s a metric that can be tracked at every stage of the user journey, as shown by this engagement loop where a visitor who is led through a process of being increasingly engaged will end up being a loyal, long-term subscriber.
Ultimately, engagement as a north star KPI allows you to become value-driven, continuing to provide and increase value for your consumers, encouraging them to engage on a long-term basis.
The question is, however, what actually makes up engagement? How can you track, compare and optimize it?
Engagement is made up of 3 individual metrics, together making up the RFV score.
⭐️ Recency - the number of days since a user last visited your site.
For content producers, the higher the value, the less engaged the user is and the more effort should be used to bring them back.
⭐️ Frequency - the number of days a user has been visiting your website within a given time period.
In this case, the higher the value, the better, with the goal being to form a habit of consuming your content. A low frequency of visits suggests a weak or non-existent habit, meaning the user is more likely to leave your site and not convert or churn if they’re already subscribed.
⭐️ Volume - the amount of content consumed and interactions made with your site (basically the quality of their visits, showing that they see value in your content). It could be articles read, time spent on your website, or a mix of different interactions.
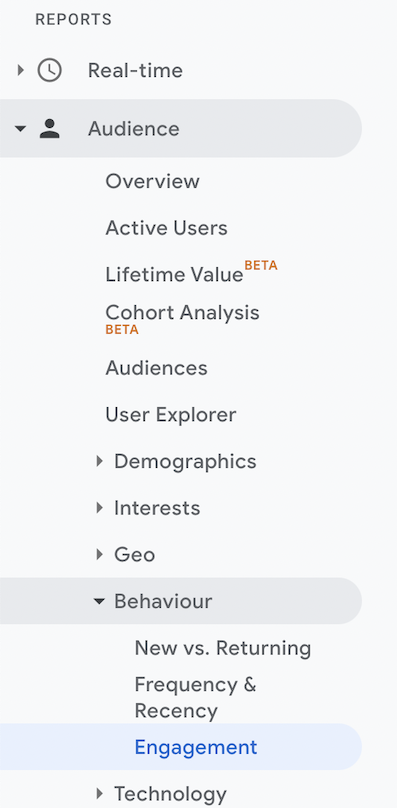
Google Analytics creates separate sections for ‘Frequency & Recency’ and ‘Engagement’, with engagement being made up of session duration or page depth and page views (i.e. volume).
The most important of these 3 will depend on your business model so this is something you should work out from analyzing subscribers and discovering which metric is the biggest indicator of a high CLV and retention. However, the combination of the 3 gives you an overall view of engagement.
How best to track this metric:
- Globally, i.e. all audiences
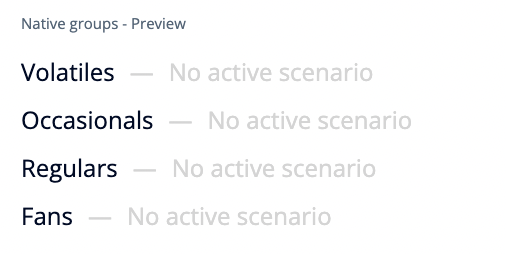
- Segment your audiences based on engagement level to create adapted journeys. Your segments could, for instance, be VORFMS - Volatiles, Occasionals, Regulars, Fans, Members (i.e. registered users) and Subscribers (also subscribers on a trial period vs full). This is the native segmentation in Poool's Dashboard
- The flow between engagement segments, such as users becoming less/more engaged and discovering what makes a user likely to move to the next engagement level
- Your own segmentation, based on user profile or context, perhaps including device used (mobile vs desktop), source of traffic (Facebook, google, etc), user location, etc.
- Intersect these segments, e.g. volatiles on mobile devices
How can you increase engagement?
Luckily for you, we have a whole white paper on this topic! We cover some of the most effective ways of increasing engagement as a content producer:
- Soft conversions: registration wall, newsletter sign up
- Content: habit forming content, newsletters, puzzles
- Personalization: algorithms, UX functionalities, messaging, notifications
- Interaction: commenting, social media
 Madeleine White
What other KPIs should you be tracking?
This white paper provides the ultimate list of KPIs that you should be tracking alongside this north star metric at every step of the user funnel - engagement, conversion and retention.
Madeleine White
Interested in having access to a Dashboard that includes native audience segmentation based on engagement and gives your marketing teams complete autonomy to build adapted user conversion journeys for each grouping?
Poool's Audience Conversion Platform lets you do exactly that and more!
- Code-free wall design builder
- A/B testing and analysis
- Make changes in minutes without tech
- Native and custom segmentation
Book a free demo now to try this all out for yourself and hear about how Poool will help you turn your audience into leads, members and subscribers!