

Welcome to the KPI playbook for digital publishers!
After having worked with over 120 publishers, supporting them in their subscription and conversion strategies, Poool’s consultancy team have come together to provide you with the ultimate guide to which Key Performance Indicators you need to track.
The playbook has been divided into 3 chapters:
- KPIs for engagement
- KPIs for conversion
- KPIs for retention & growth
Please note that although this may appear to work through a user’s journey towards subscription and (hopefully) remaining so in the long-term, engagement KPIs should be tracked throughout the funnel, even once a user subscribes. As we highlight in the ‘KPIs for retention & growth chapter’, engagement is directly correlated to retention (and ARPU for that matter) so these KPIs should be tracked continuously.
Chapter 1: KPIs for engagement
Increasing audience engagement is the first step in any revenue strategy employed by a digital publisher.
Not only does it have a direct impact on monetization through advertising (more eyeballs on page, more often and for a longer amount of time), but also on conversion rates of users into members and subscribers, meaning increased ARPU.
But how do you go about tracking engagement?
This article will provide you with a clear explanation of what makes up engagement, the KPIs needed to track it and benchmarks from Poool's clients.
What metrics make up engagement?
Engagement is one of those words that we all understand but may struggle to clearly define - it's not only about occupying someone's interest but also involving them or persuading them to participate in something.
This definition can be transferred into 3 individual metrics, together making up what's called the RFV score - recency, frequency, volume.
⭐️ Recency - the number of days since a user last visited your site.
For most content producers, the higher the value, the lower the level of engagement.
⭐️ Frequency - how often the same individual visits your site within a given time period.
In this case, the higher the value, the better, with the goal being to form a habit around consuming your content. A low frequency of visits suggests a weak or non-existent habit, meaning low propensity to register/subscribe or, for subscribers, a higher likelihood that they'll churn.
⭐️ Volume - the quantity of content consumed and interactions with your site. This basically tells you the quality of a user's visits - whether they read a lot of content, spent time on your site, completed various actions, etc.
Most engagement metrics will be based on one or a combination of these. However, as with everything, engagement is unique to each publisher and you may prioritize one of these metrics over the others.
Therefore, we'd recommend considering the KPIs outlined below and deciding which align best with your strategy, content and audience.
What specific KPIs can we use to measure engagement?
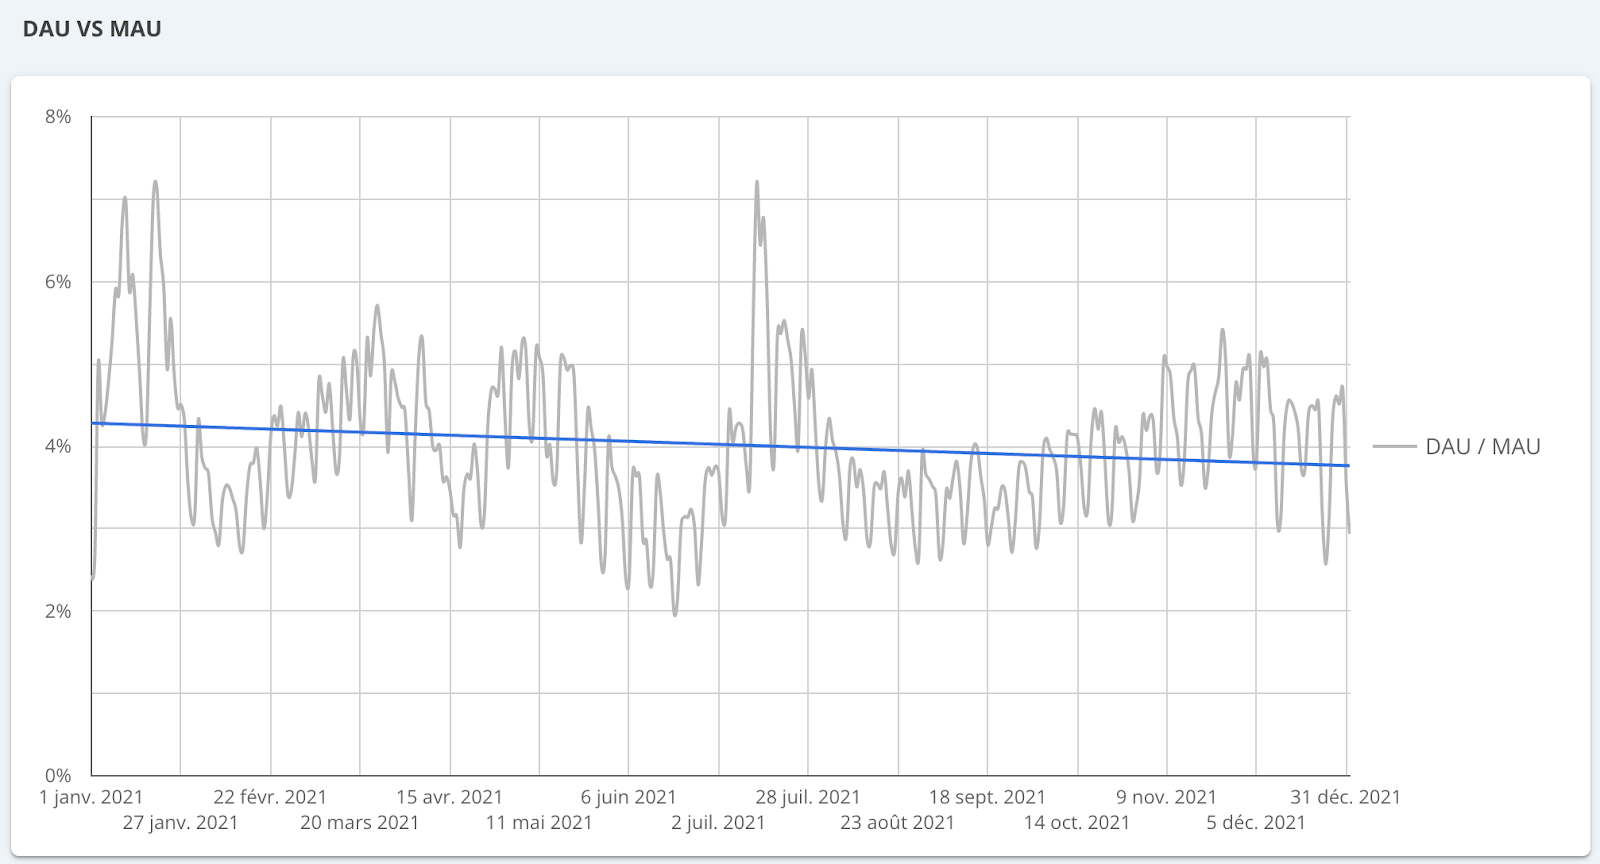
DAU / MAU ratio
= Daily Active Users compared to Monthly Active Users, also called stickiness
🎯 This measures the proportion of monthly active users that return to your site on a daily basis. It’s useful for understanding the global engagement of users and loyalty that they have to your brand (i.e. do they return to you daily for their content or other sites?).
This metric is particularly important for publishers who produce content on a daily basis (daily newspapers for instance), but for other content producers (such as monthly magazines or those who publish less regularly), this KPI can be adapted to match your own periodicity.
⭐️ We've found an average DAU/MAU of 5-8% amongst our digital publisher clients - this means that, on average, their users return to their site 5-8 days out of 28 (a month).
How can you measure DAU/MAU?
To start with, you need to define two things: Users (often quite simply a visitor to your site) and Actions (you could consider this as visits to your website in general or consuming content, such as clicking on links or scrolling a certain amount down an article).
You can then export your DAU and MAU data from Google Analytics, or other tool
🧮 'Daily' active users ÷ '28 day' active users
To visualize this data, we'd recommend using DataStudio (if you’re employing GA that is):
Engaged View Rate (EVR)
🎯 This engagement view focuses on the quality of a user's visit to your site, the idea being that users who have surpassed a certain number of seconds on-page and scrolled to a certain depth are considered as engaged in your content. It’s famously employed by publishers such as Financial Times and The Economist.
The measurement of an engaged user according to EVR differs from publisher to publisher, so you first need to settle on the number of seconds and scroll depth of your engaged visitors.
- Scroll depth: good scroll depth indicates that your content is engaging and interesting to your users. Google Analytics allows you to track scroll depth ( this article explains how) or you can consider heat map technology
- Average time spent on page: this has to be taken with a pinch of salt and understood in the context of your specific content (for instance, some sites will want users to move quickly through each page as it suggests they found what they were looking for). You'll also notice that some publishers track time spent per session rather than on-page. Both work, but 'per session' perhaps reflects the importance of recirculation and the desire to continue to engage users even after they've read one content. Note that Google Analytics doesn't provide accurate data for this metric - instead, use:
🧮 Average time spent on page = Total time spent ÷ (sessions - bounces)
Once you understand these two metrics individually, you can create an EVR that's accurately adapted to your content and audience.
For example, at Poool, we consider an engaged user as someone who spends at least 30 seconds on a content and scrolls to 66%. We can therefore use the following equation:
🧮 EVR = (users spending 30 seconds on content and scrolling to 66%) ÷ total users
You can then put this metric to practice in measuring the performance of individual content, categories of content, based on device, source of traffic, etc.
Overall DAU/MAU is more of a global engagement metric, measuring user loyalty, whilst Engaged View Rate focusses more on a specific content.
Daily active subscribers
🎯 Track the engagement of your subscribers to see if they log into your site on a daily basis. Not only will this allow you to understand whether you have successfully formed habits in your user’s lives, but it will also help you to reduce churn and put preventative measures in place for subscribers who seem less engaged (and so likely to unsubscribe).
How can you measure this?
There are two points to track in this KPI:
🧮 In Google Analytics or similar tool, track your subscribers’ frequency of being active on your site to understand if you premium offer is engaging, if you’ve formed content consumption habits, built loyalty, etc.
This can be achieved through creating a personalized group in GA with the audience segment ‘subscribers’.
🧮 In your CRM you can also track the recency of visit of each individual subscriber to identify those who look likely to churn, allowing you to put a preventative, re-engagement strategy in place.
💡 You can apply this same methodology for a membership offer, measuring the percentage of registered members than login daily.
Soft conversion for engagement
As established, engagement is about high quality visits to your site and content on a frequent basis. Overtime, this will increase a user's ARPU and propensity to subscribe to your premium offers. So it's in your interest to seek to increase engagement.
One of the most effective ways of achieving this is through soft conversion steps, such as account creation or registering for your newsletter. These not only add value to your user's experience on your site but also help to establish content consumption habits which make a user return to your site regularly.
So, how can you track the value of soft conversion steps for increasing engagement?
Percentage of unique visitors who have signed up to the newsletter
🎯 Measuring how attractive your newsletter (and its value proposition) appears to visitors on your site
How can you measure this?
🧮 In Google Analytics or similar, create a goal of 'NL signups' and directly compare to unique visitors.
Equally, you can track the engagement of your emails themselves, including open rate and click-through rate on email links:
🧮 Email open rate = unique open emails ÷ (total number of emails sent – total number of bounced emails)
🚨 However, be aware that open rate is also related to deliverability. We’d therefore recommend checking the deliverability of your emails and putting measures in place to ensure these emails don’t go to spam.
🧮 CTR on email links = total clicks ÷ number of delivered emails) x 100
Percentage of unique visitors who have created a free account
🎯 Measuring how attractive your membership offer (and its value proposition) appears to visitors on your site
How can you measure this?
🧮 In Google Analytics or other tool, create a goal of ‘Account Creation’. You can then measure the ratio of anonymous vs registered traffic by creating a custom dimension in GA of ‘Members’.
A valuable way to increase this indicator is to employ a Registration Wall as part of your user's engagement journey towards subscription. This conversion tool blocks content and asks or requires a user to create a free account in order to gain access.
The key to a successful registration strategy is to provide value in exchange for this account creation, such as access to additional content, exclusive newsletters, UX functionalities (such as ability to save content for later, resume where they left off, etc) or perhaps access to more engaging, interactive content, like games or quizzes.
Discover the best registration wall examples of 2022:
 Madeleine White
Audience segmentation based on engagement
KPIs are one thing, but putting them to use in your strategy is the next step to increasing your ARPU in the long run!
In order to effectively employ an engagement strategy, we highly recommend segmenting users based on their level of engagement and providing adapted journeys with the goal of increasing this engagement over time.
Poool segments their audience into 4 central groups prior to membership and subscription-
Volatiles, Occasionals, Regulars and Fans, each with an increasing level of engagement.
In fact, we conducted a study* of digital publishers based off these engagement levels, analyzing the averages of 3 key performance indicators:
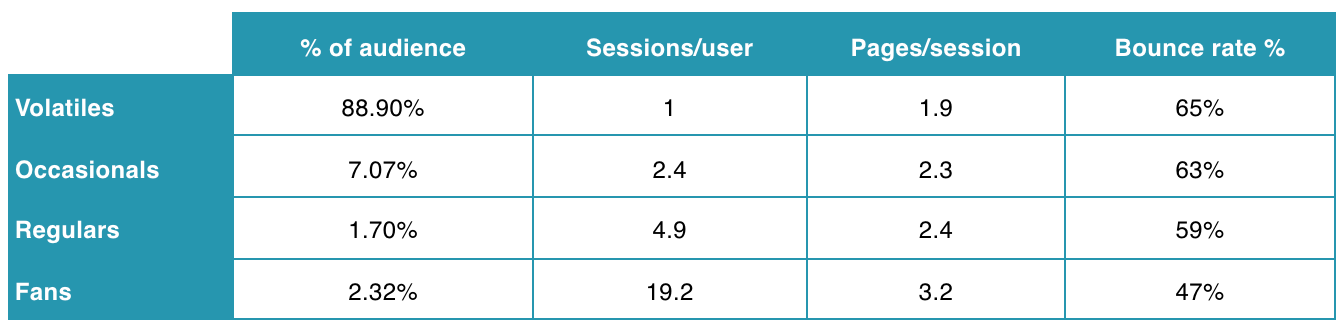
Volatiles - they make up the majority of your visits but are the least engaged. At this stage, you should focus on collecting compliant consent (to be able to at least monetize from advertising) as well as form content consumption habits, such as by encouraging newsletter sign up, recommending that they turn on push notifications or download your app.
Occasionals and Regulars - they're slightly more engaged, but this stage should be all about developing strong relationships, increasingly loyalty and optimizing the user experience. This can be achieved by converting these users into members via a registration wall strategy.
Fans - your most engaged, non subscribed users who should (by this stage) be ready to subscribe. You can therefore present a paywall to create a certain level of frustration that encourages them to click through the wall and pay to access more content.
*Poool’s study analyzed the digital audience of 42 French publishers producing a variety of written content, including regional and national press, pure-players, and entertainment content publishers. The data collected from visitors to the publisher’s site was then divided into 4 cohorts based on the user’s level of engagement, namely Volatiles (who made up 88.9% of the overall audience), Occasionals (7.07%), Regulars (1.70%) and Fans (2.32%).
Chapter 2: KPIs for conversion
After having led your user through an engagement journey, gradually increasing their propensity to subscribe, the next step is the all important conversion.
The user first passes through the paywall, then continues down the conversion funnel, completes payment and becomes a subscriber.
But we all know it’s not as simple as that - every step can be a friction point and potentially lead to a user abandoning the process. It’s therefore vital to track metrics throughout this conversion journey to discover what these friction points are and understand what needs to be done to optimize conversion rates.
This second section of the playbook will detail KPIs for each step of the conversion funnel, from premium content blocked by a paywall to subscription.
However, it’s important to highlight that conversion rates are also dependent on other factors, such as your content, value proposition and your audience’s level of engagement. Users who aren’t engaged in your content, and barely visit once a month, won’t likely subscribe even if you do have a perfectly optimized conversion funnel. Equally, if you don’t clearly communicate your value proposition or offer a premium experience that your users consider as worth the cost of subscription, even your most engaged users may not be persuaded to subscribe.
Engaged user to subscriber
Before working through the conversion funnel, you can put engagement KPIs to use in discovering the user behavior that leads to subscription.
These are called ‘weak signals’ and allow you to put more effort into this area as you know it supports conversion rates. For instance:
- How many articles does a user read per month before subscribing?
- What is their EVR (Engaged View Rate - see chapter 1 of the playbook)
- Is there a link between subscription to your newsletter and conversion?
- Is there a link between creating a free account and conversion?
- Is there a link between someone who consumes content across multiple mediums (website, app, newsletter, etc) and conversion?
- What about users who comment, interact with your content, turn on push notifications, etc.
The conversion funnel
The conversion funnel itself starts at the paywall and continues until your new subscriber can access premium content.
Each step of this funnel will have its own KPIs to track and should be considered as a separate part of the overall conversion ‘machine’ - if one step doesn’t do its job and isn’t properly managed, then you’ll likely not get the product of conversion.
From our conversion funnel analysis of 9 successful content producers, we found a typical user journey involved:
- Being blocked by a paywall
- Subscription offers page
- Registration/form fields
- Payment
- Confirmation and onboarding
We’ll provide KPIs for each of these steps. However, one metric can be tracked throughout the conversion funnel…
Conversion Rate
🎯 This measures the percentage of impressions that resulted in a user moving to the next step. It can be compared to click-through rate (CTR), which is often mainly used for tracking advertising or email marketing performance, however conversion rate involves completing any action (whether that be clicking or not) that moves the user to the next step of the funnel.
I.e. For each stage in the funnel, out of the number of users who reached this point and visited the page, how many converted through to the next step?
🧮 (Total number of users converted to the next step ÷ total traffic on page) x 100
This can be used to measure the performance of each individual step in the funnel, but also more globally.
For instance, how many visitors to your premium content convert into a subscriber? Or, even more global, what percentage of your site traffic converts into a subscriber? This would be measured with:
🧮 (Total number of converted users ÷ total traffic to site) x 100
1. Premium content and paywall KPIs
Traffic share on premium content
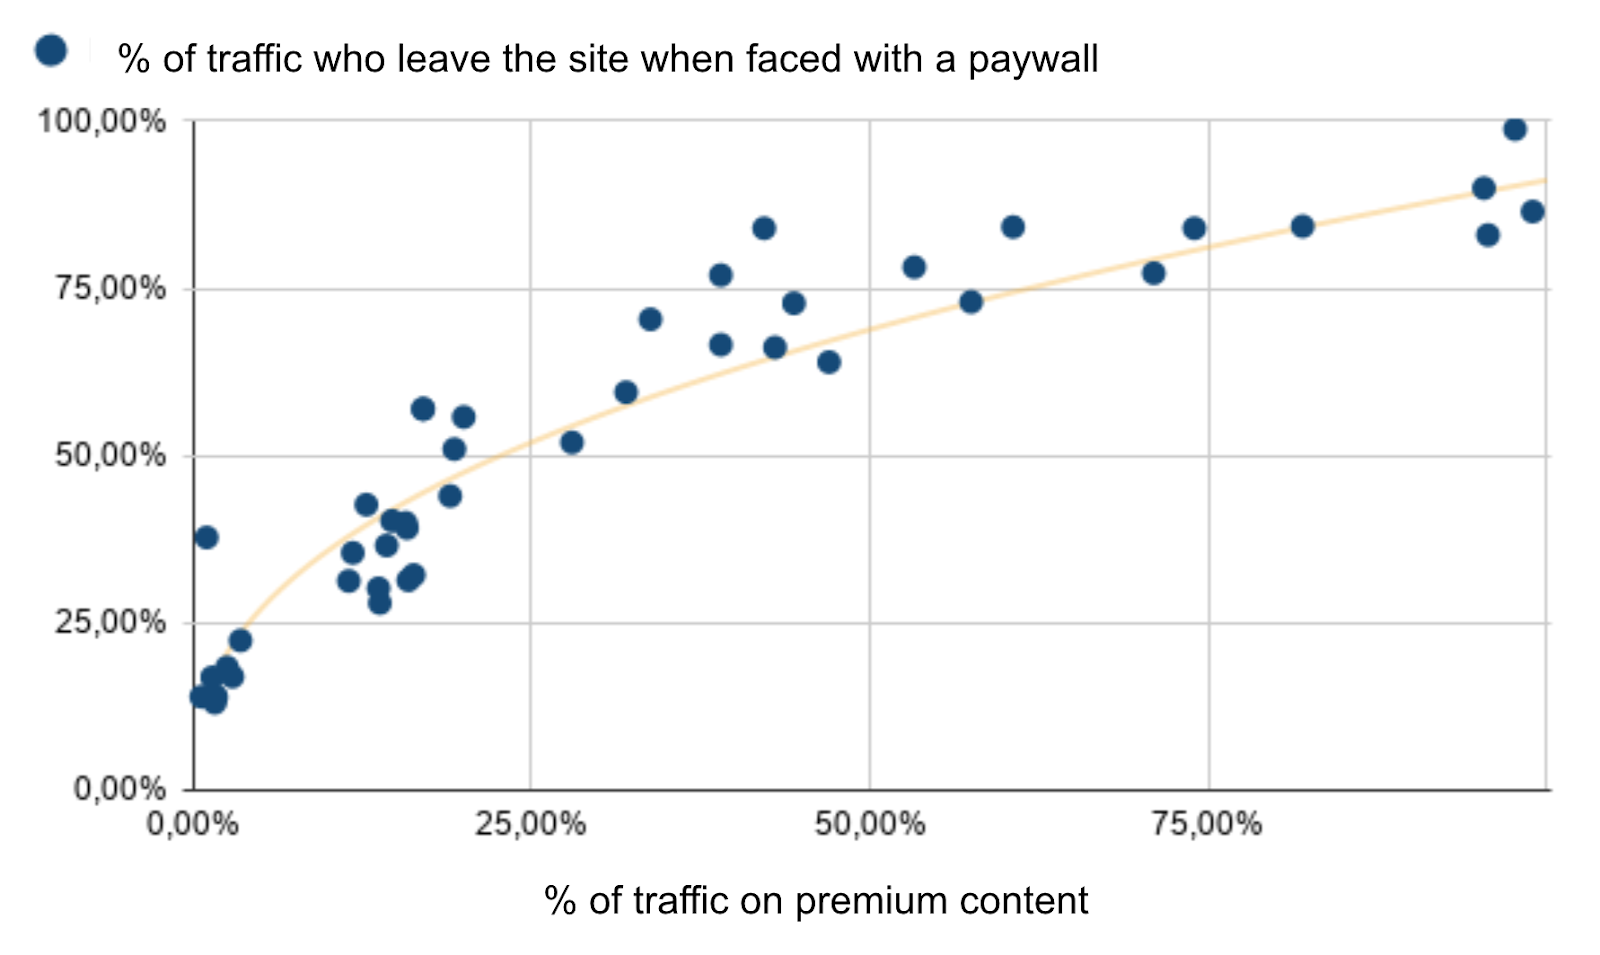
🎯 In our Digital Media Review, analyzing 75 publisher’s subscription and paid content strategies, we found a correlation between traffic on paid content and the reader-to-subscriber conversion rate, up until a certain point. This would imply that increasing traffic share on paid content will increase the number of users who convert.
To achieve this, you don’t necessarily need to produce more premium content, but simply increase the visibility of the paid content that you already produce. For instance, you can place this content higher up on your homepage, promote it in your newsletter, recommend this content within free articles, etc.
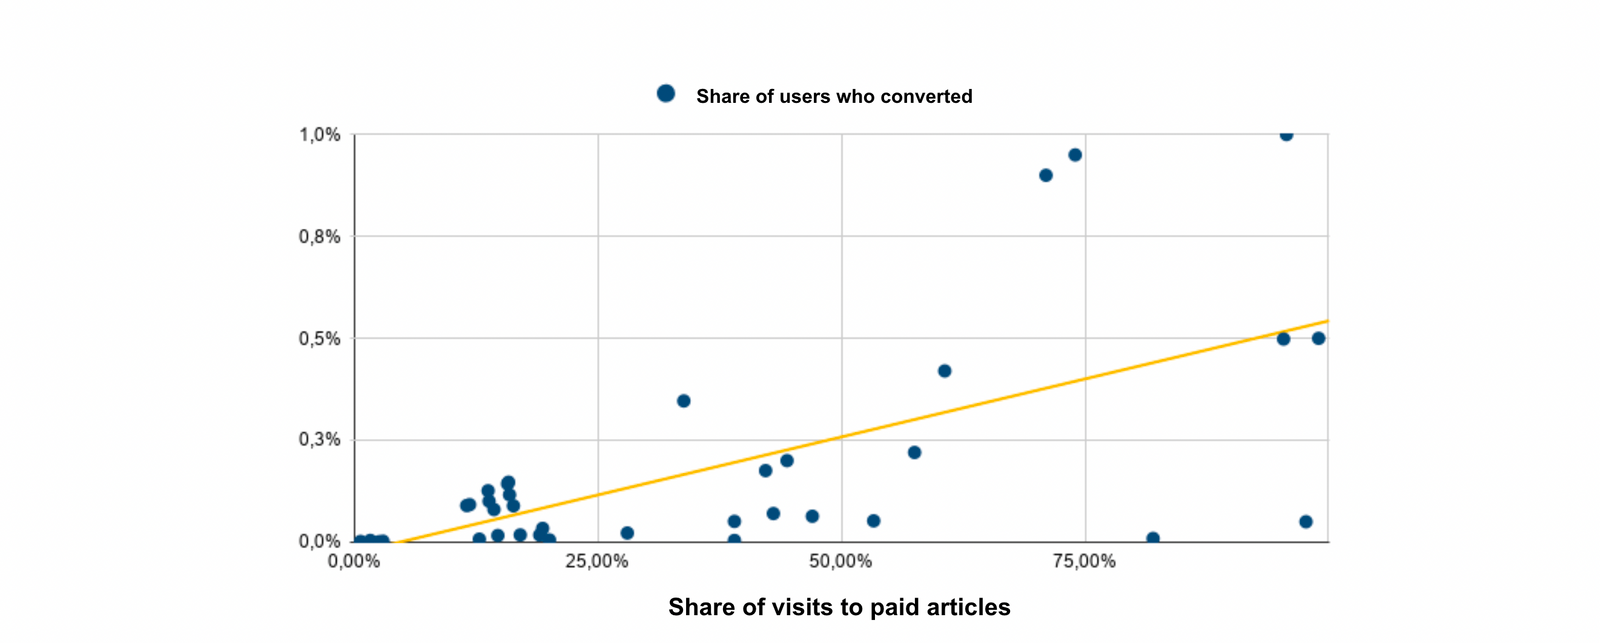
⭐ Our research found that this correlation was valid but only up to 40% visibility of paid content. Therefore, you should aim for between 10-40% visibility, putting tests in place to discover the optimal visibility for your audience.
🧮 Traffic share on paid content = (traffic on paid content ÷ total traffic on any content) x 100
Paywall visibility rate
🎯 What percentage of traffic on paid content actually see your paywall? This is particularly important for written content where the paywall is far down the page and requires that the user scrolls to see it. Of course, this metric impacts conversion rates (a user who doesn’t reach the paywall won’t likely convert) and should be measured alongside scroll depth on premium content.
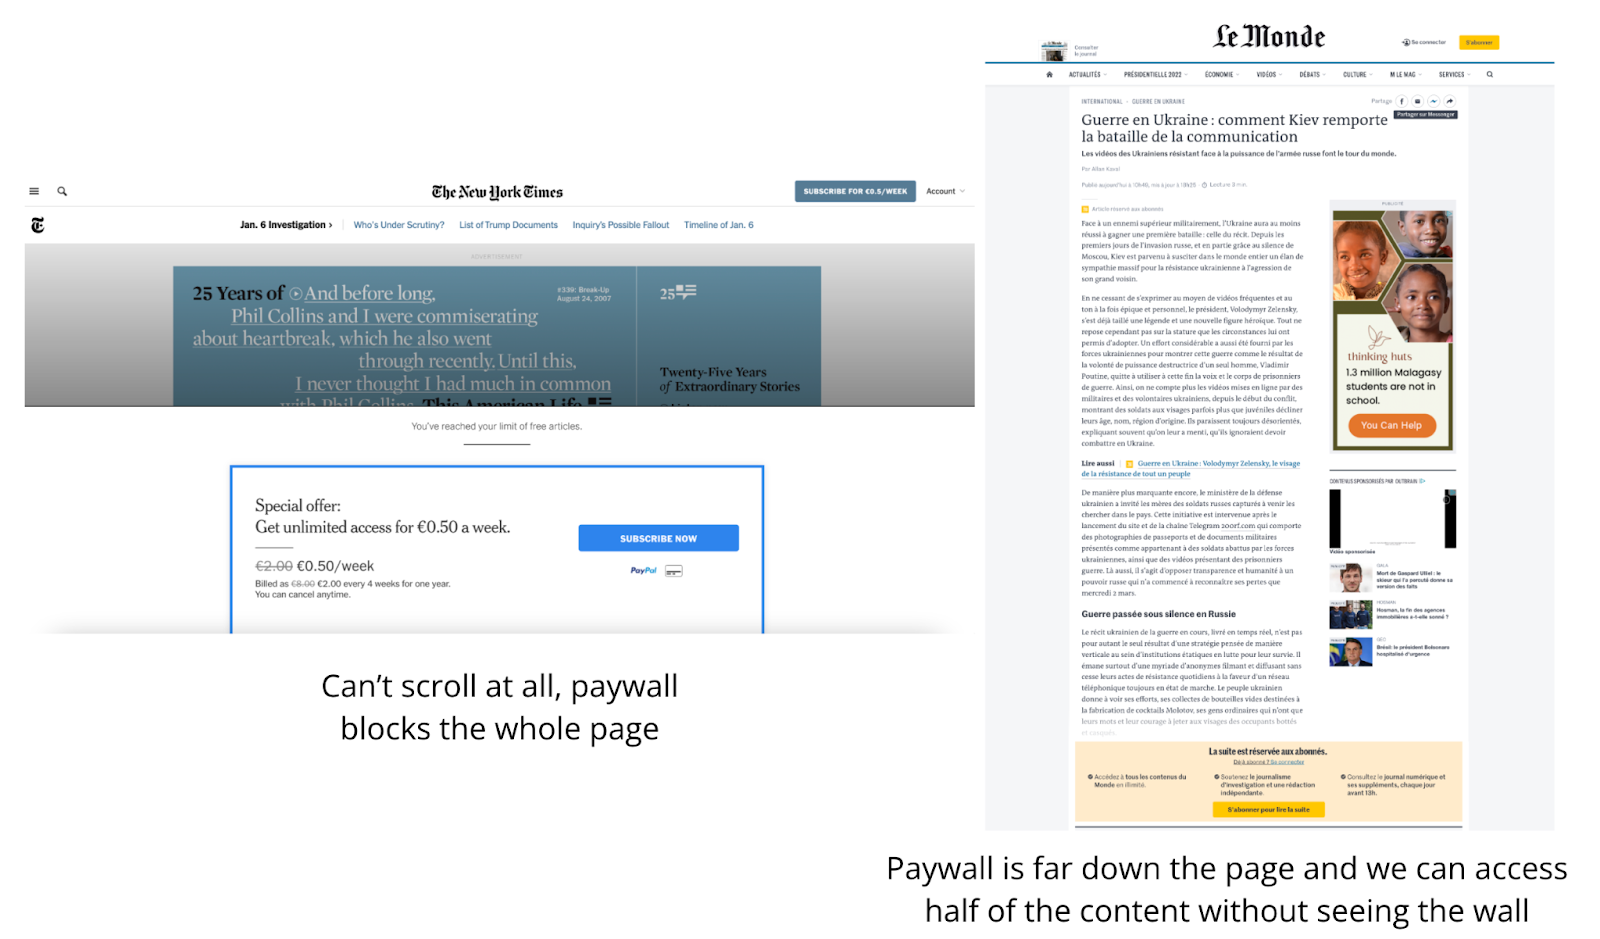
🧮 (Traffic on paid content who scroll far enough to see the wall ÷ total traffic on paid content) x 100
🚨 Be warned, a high paywall visibility rate isn’t necessarily optimal for your strategy.
Of course, if you have a low paywall visibility rate, you risk losing a lot of potential subscribers (and so revenue). Equally, however, if you’re reliant on advertising monetization, a full screen, 100% visibility paywall will hide all commercials and significantly reduce your RPM. The goal therefore is to find the optimal wall visibility rate based on your strategy and revenue model.
💡 Top tip - it’s also important at this point to think about SEO. By blocking your content with a paywall, you may put your SEO performance at risk. However, you can successfully find a balance between paywall optimization and reducing the risks to SEO performance by employing a ‘lead-in’ approach - this refers to a hard wall strategy that still leaves the content title and first paragraph/executive summary open to readers, allowing for both content discovery and giving search engines the information needed to rank the content.
Discover more about Paywalls and SEO in our dedicated white paper.
Maxime Moné
Meter Stop Rate (MSR)
🎯 This metric only applies to publishers employing a metered paywall strategy and refers to the share of users who exhaust their quota of free content and reach the paywall.
As usual, this metric is about finding the balance between engagement and frustration. You need to create a certain amount of frustration by ensuring users reach the end of their free sample and see the paywall, but you also need to allow them to discover and engage in your content so that they see enough value in your product to want to subscribe.
🧮 (Unique visitors hitting a paywall ÷ unique visitors) x 100
⭐ A report by the Local Media Association shows a wide MSR range amongst digital publishers, highlighting how dependent this metric is on the publisher’s business model and audience. From their research, they suggest a goal of 5-7% MSR.
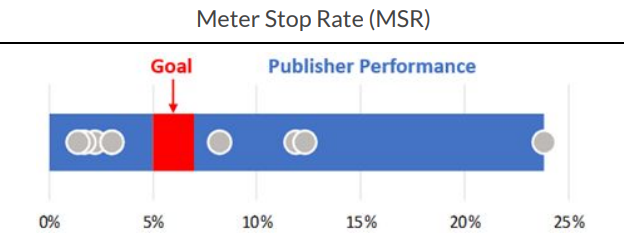
However, Poool’s own research in the Digital Media Review suggests that this benchmark has risen significantly since the LMA study. In fact, studies showed that the percentage of traffic being presented with a paywall went up by 10% in just a year, between 2019 and 2020.
Paid Stop Conversion Rate (PSCR)
🎯 PSCR tracks the number of users who hit the paywall and end up converting into a subscriber, measuring the overall effectiveness of your paywall as the first step in the conversion funnel. Of course, for any visitors who don’t subscribe, it may not be your paywall that is the problem but another step of the funnel (or an external factor), but this is still an important metric to track and compare to conversions from other parts of your site, such as CTA buttons in your menu, newsletters, etc.
🧮 (Unique visitors who click through the paywall and subscribed ÷ unique visitors hitting the paywall) x 100
Exit rate on premium content
🎯 Find the balance between frustration and engagement on your premium content by measuring how many users leave the page when faced with a paywall.
You can track this by analyzing the bounce rate on specific pages through GA, or similar - in this instance, the bounce rate on premium content.
🧮 (Visitors on premium content who see the wall but leave ÷ visitors on premium content who see the wall) x 100
⭐ This helps to track the effectiveness of this specific step and discover friction points in the conversion funnel. Therefore, this metric can be tracked at every step - i.e. departure rate on the subscription offers page, payment page, etc.
2. Subscription offers page KPIs
(conversion rate & exit rate as the KPIs to track at every step)
Clicks on subscription offer CTA buttons
🎯 Discover which subscription offer CTA button is clicked on the most by your users, whether they end up converting or not. This will enable you to understand what users value - Do they prefer paying monthly or yearly? Do they prioritize cost? Are there certain features of your offer that they seem to value most?
💡 A/B test like crazy!
As with every step, we recommend carrying out A/B tests to discover the optimal design, wording, etc for each page. And this is certainly the case with the subscription offers page - should you highlight one offer over others, which colors perform best for CTA buttons, what value proposition points seem to convince users to subscribe?
Trial offer conversion rate
🎯 If you offer a free trial or reduced first week/month, what percentage of users who sign up for these offers then continue subscribing? This helps to discover the effectiveness of your introductory offers and can be analyzed alongside a user’s lifetime value to see if trial periods lead to long-term subscribers.
🧮 TCR = (subscription trials started in month X who converted to full-paying subscribers ÷ subscription trials started in month X) x 100
3. Account creation KPIs
(conversion rate & exit rate as the KPIs to track at every step)
Form abandonment rate
🎯 A key metric to track is the abandonment rate on the account creation form, and ideally discover where the user abandons (after how many form fields) to discover which parts are discouraging users from moving to the next step and leading to them leaving the form.
With forms that are spread over multiple pages (such as on mobile when you typically have one form field shown at a time), it’s fairly simple to discover where the friction point is within your form. However, it’s slightly trickier for single-page forms. One solution is to make some form fields non-mandatory, which helps you discover what information users don’t want to give or at what point they give up on filling out the fields.
💡 Note that employing soft conversion steps prior to the paywall can prove hugely beneficial for increase conversion rates at this stage of the funnel. Thanks to the registration or newsletter wall, you’ll have already collected key data points and can consider skipping this data-collection part of the funnel.
By making the funnel shorter, easier and requiring less information/effort from your audience, you support high conversion rates and remove potential friction points.
4. Payment page KPIs
(conversion rate & exit rate as the KPIs to track at every step)
Just as with every step, you can track conversion rates and exit rates to analyze the success of this individual step in the funnel. However, these KPIs on the payment page are more important than ever. Payment is the final decision-making stage - the point at which a user commits or not to subscribing. Therefore, although these metrics will give you insights into this specific step in the funnel, it may also indicate the success of the whole process, whether you have reassured your user enough, whether you have clearly conveyed the value you offer subscribers in exchange for payment, etc. There are many factors at play!
But, by combining these metrics with those collected throughout the rest of the conversion funnel and user journey, you should be able to figure out what needs optimizing.
Preferred payment method
🎯 Which payment method is the most popular for subscribing? This is useful for considering integrating widely recognized (and trusted) external payment companies like Paypal and Apple Pay which may be preferred by users and make the difference between subscribing or not.
You can also compare this KPI with a user’s LTV - there may be a correlation between using a certain payment method and remaining as a long-term subscriber which could benefit retention rates if these insights are put into practice.
5. Order confirmation/onboarding
(Congratulations, you have a new subscriber!)
Not every publisher will have onboarding features, so this may not be relevant to you. However, we would highly recommend this step of the funnel - it’s your first chance to welcome and engage a new subscriber, ensuring they continue to subscribe and don’t churn.
Activation rate of onboarding features
🎯 This measures whether new subscribers complete the onboarding process and activate the features or complete the actions that you recommend to them.
If you have a high activation rate (and especially if the process leads to a better user experience & increased engagement) then the onboarding is valuable, but, if not, then it might be a waste of time and have a negative impact on your subscriber’s first impression.
🧮 (Users who complete the desired action ÷ total subscribers led through the onboarding process) x 100
Tools like Google Analytics provide easy ways to track activation rate of such things as onboarding features.
💡 If your onboarding activation rate is low, dig deeper and try to discover why - is it that the process isn’t offering features that users find valuable? Or perhaps the process is too long and exhaustive.
Chapter 3: KPIs for retention and growth
Most might assume that audience acquisition and conversion are the most valuable ways to grow a subscription business. However, these efforts are worth nothing if customers don’t remain subscribed in the long-term. Arguably, therefore, customer retention (alongside reduced customer acquisition costs) plays the most essential role in sustainable business growth.
Firstly, retention (of course) means recurring revenue from subscribers who continue to pay on a regular basis, not to mention the fact that retaining a customer is 5-25 times less expensive than acquiring a new one.
Secondly, it relates to customer satisfaction levels. In today’s highly competitive market, smart retention strategies and well developed relationships with subscribers supports acquisition efforts as your satisfied customers become brand advocates, sharing their positive experience, promoting your premium offer, etc through online reviews and word-of-mouth.
And, finally, retention supports sustainable growth. It can be tempting to primarily invest in short term solutions, but the most effective solutions are in fact long-term. By establishing recurring subscription as a predictable revenue stream, and looking beyond acquisition, you’ll be able to invest resources in the right places to support profitable, sustainable growth.
This is why metrics and data collection on user retention is so valuable - without it, you won’t know if you’re employing a successful retention strategy and maximizing the value of your current subscriber base (who you’ve spent time and money on acquiring and converting).
What’s more, these KPIs can give you insights into what actions and behaviors imply that a user is close to churning. Thanks to this understanding, you’ll be able to put preventative measures in place to increase retention rates and continue to monetize your audience sustainably in the long run.
“Reducing your churn rate by 5% increases your profitability by anywhere from 25 to 125%.” - Saasquatch
Acquiring customers vs Subscriber value
It takes a lot of time and money to generate leads, engage them in your content and convert a certain percentage into subscribers, which is why understanding customer acquisition costs compared to subscriber lifetime value is hugely important.
Customer Acquisition Cost (CAC)
🎯 The expense of acquiring a new subscriber, worked out by combining all costs associated with marketing efforts.
🧮 Customer Acquisition Cost = Marketing costs ÷ customers acquired
Average Revenue Per Subscriber (ARPS)
🎯 ARPS gives you insights into whether users are upgrading or downgrading their subscription plans, putting this information to use in building your offers and products. Of course, you’ll be tracking ARPU (average revenue per user), most likely as a north star metric, but this KPI gives you information about subscription as a revenue stream alone (without advertising, etc).
🧮 ARPS = revenue from existing subscribers ÷ number of existing subscribers
Alternatively…
Customer Lifetime Value (CLV or CLTV)
🎯 The total net revenue that you expect a subscriber to bring your business throughout their entire time as a paying customer. Seeing as this KPI directly correlates with increased revenue from subscribers, it allows you to justify spending more on retention strategies in order to ensure subscribers continue to pay and build up a high lifetime value.
- CLV directly affects revenue
- It represents loyalty and retention
- It provides insights into your most valuable customers (to target them and identify potential long-term subscribers)
🧮 CLV = Average customer value x Average customer lifespan
CAC has a direct relation with CLV. Therefore, after calculating these two KPIs, you can compare them to understand the health and sustainability of your subscription model. If we consider LTV:CAC, a 1:1 ratio would mean that you’re losing money with each subscriber acquired and that the strategy isn’t sustainable for long-term growth. A 3:1 ratio on the other hand is considered the ideal benchmark for most businesses, representing a sustainably profitable model.
Monthly Recurring Revenue (MRR)
🎯 MRR tells you how much revenue you can reliably count on every month. This is arguably the greatest benefit of a subscription model as you understand and predict the exact revenue that you’re going to receive from your audience on a regular basis, allowing you to invest this cash flow into different areas of your business.
If you have multiple subscription offers, you can calculate an overall MRR as well as individual MRRs for each offer.
You can also break MRR down further to fully understand the health of your subscription model, splitting overall MRR into:
- New MRR = revenue that comes from acquiring new subscribers
- Expansion MRR = this is about up-selling and cross-selling, i.e. your ability to earn additional revenue from your existing subscribers
- Churn MRR = the revenue lost from subscribers who cancel or downgrade their subscription
🧮 MRR = average monthly revenue per subscriber (ARPS) x total number of subscribers
Retention is essential to your subscription model
As we’ve highlighted, acquisition can be timely and costly, whilst retaining a subscriber (i.e. increasing CLV) can prove hugely valuable to your business. In fact, as Grzegorz Piechota highlighted at the INMA World Congress, just a small number of users can provide you with a large percentage of your total revenue.
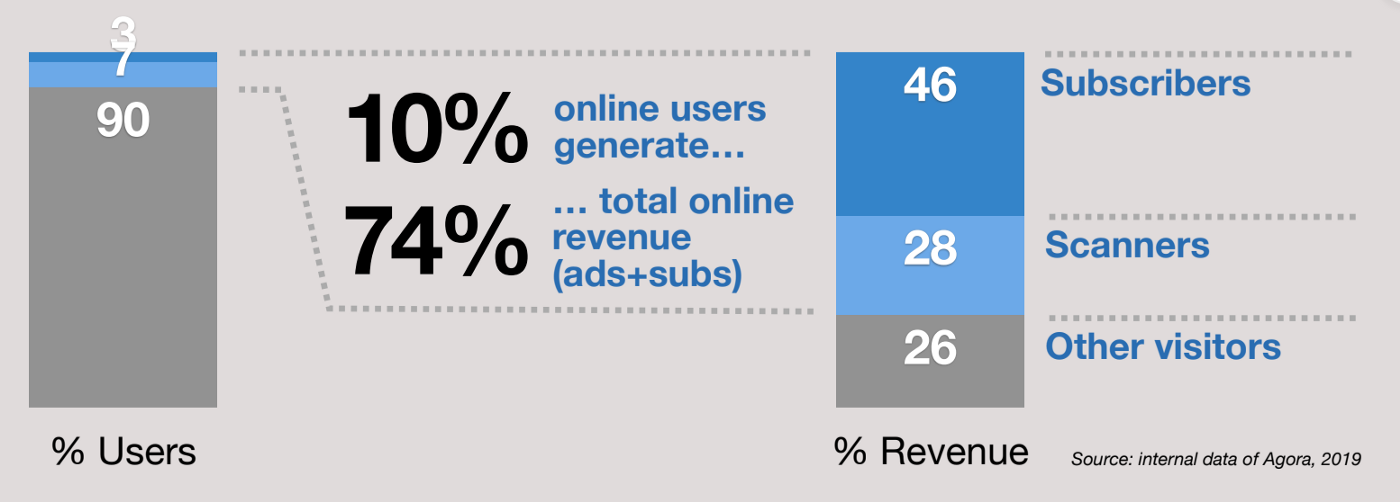
KPIs associated with revenue are therefore essential to track and seek to improve for the success of your subscription strategy.
User retention rate / churn rate
🎯 Retention rate is used to discover how many users are remaining subscribed to your offer. It’s the direct inverse of churn rate, which tracks how many users are canceling their subscription. This can be tracked over any given period (week, month, quarter, year) as well as measured in segments to truly understand what makes a subscriber less likely to churn in the future.
For instance, you could measure retention rate compared to how and when a user subscribes (i.e. through a paywall, after becoming a member first, after signing up to your newsletter, etc), which offer they’re subscribed to as well as compare retention rates with their behavior as a subscriber (e.g. their engagement rate).
🧮 User retention rate = Number of subscribers who continue their subscription ÷ total number of active users at the beginning of time period
MRR retention rate / churn rate
🎯 To be calculated alongside user retention, MRR retention refers to the revenue maintained over time from your user’s recurring subscription payments, once you deduct MRR lost from churn. The easiest way to think of this is in terms of MRR churn, split into active and passive churn:
🧮 MRR churn = sum of revenue lost from active cancellations + sum of revenue lost from passive churn
Why is this important to track alongside user retention?
Whilst user retention provides information about your subscription product, pricing and services, MRR retention allows you to understand whether your company can sustain profitability.
For instance, let’s say that in January you have 7 subscribers who churn, whilst in February you only have 3. This would result in an improved retention rate in February than in January.
However, what if these 3 subscribers who churned in February were on your highest-tier plan, whilst the 7 who churned in January were on your lowest-tier or even free trial plan? This could result in a MRR retention rate that’s lower in February than in January, representing a decreasing MRR and a potentially unsustainable business model.
So, whilst it’s important to understand how many subscribers are churning, the success of your subscription model is centralized around the revenue that you gain (or are losing) from these users.
Note on churn prediction modeling
Churn prediction modeling is the task of identifying common behaviors and attributes shared by users who cancel their subscription. These ‘churn signals’ will allow you to predict churn and put preventative measures in place in order to improve retention rates and CLV.
Preventative measures could include sending a personalized special offer or simply an email reminding the user of what they have access to with their subscription package. However, in general, given that there’s a significant correlation between subscriber engagement and retention, these measures should involve re-engagement.
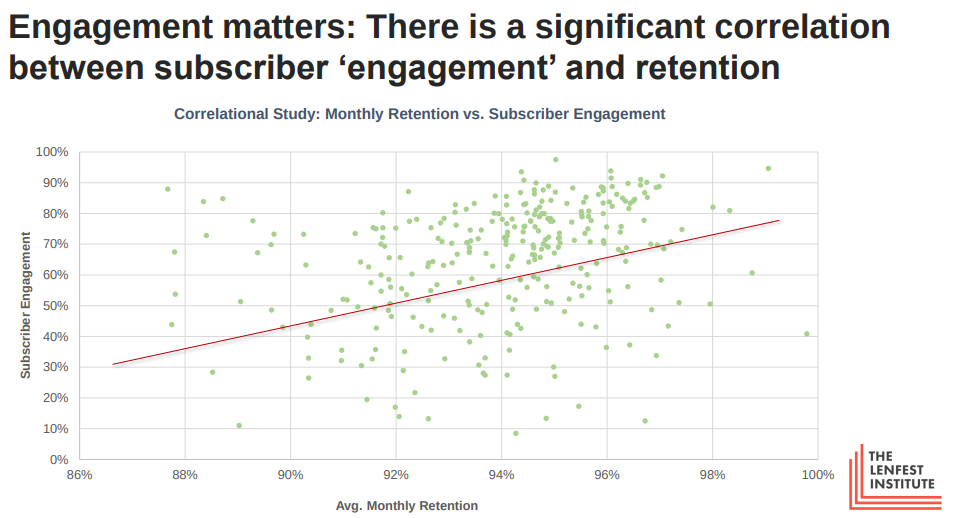
(The Lenfest Institute study)
In addition to ‘learning for the next time’, you may have windows of opportunity to win subscribers back before they lose access to their premium benefits. If, for instance, a subscriber cancels their subscription 3 weeks before the end of the month (when they’d normally pay again), you have 3 weeks of significant opportunity to increase retention. In this instance, even a simple customer service call to discover the cause of the churn, and try to provide a solution, can prove hugely beneficial to your revenues.
💡 Did you know that Poool has a team of consultancy experts, ready to support you in your registration and subscription strategies?
Allow me to introduce...
Anthony Ribeiro - Specialist in conversion and retention with over 7 years experience working with digital publishers, including The Economist, The New York Times and PlayBac Presse.
Ludivine Paquet - 3 years experience in the publishing industry, working on diversification strategies, specializing in conversion methodologies & data analysis, having worked with Prisma Media group.
Marion Wyss - Co-founder of our consultancy offer, with 10 years experience in digital content, working with ELLE, Challenges and L'OBS, specializing in product quality, engagement & conversion.
Book a free demo and meeting with the team to discover how we’ll help lead your business to success! Just pick a slot that suits you!