

You don't know it yet but this newsletter is the final one before an exciting change is happening at Poool… all will be revealed next week, on October 13th, and I’m trying my hardest to keep my lips sealed but I’m 1000% certain that you’re going to LOVE it!
For now, back to business! On today’s agenda:
- The data on mobile conversion rates and how to increase them
- 1 subscriber or 48,000 page views? The ad vs subscription question you’re asking
- Personalize newsletters to maximize on engagement
- Final note to share some very exciting news
Increase conversions on mobile
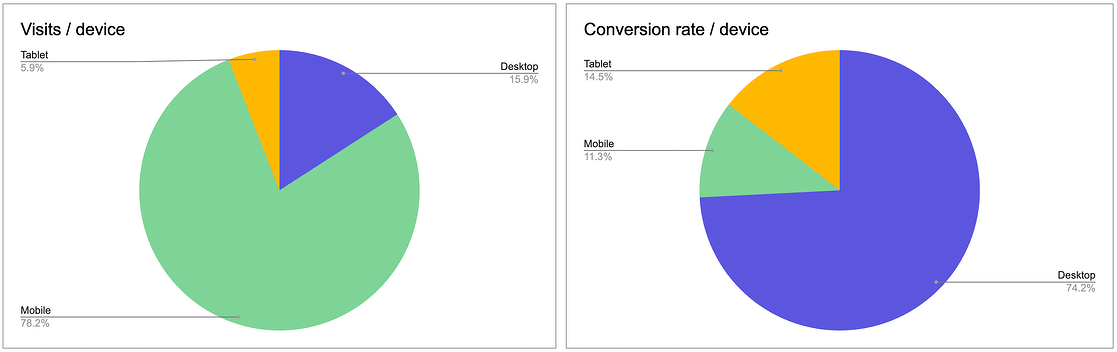
The data is clear.
There are significantly more visits to content on mobile (78.2%) compared to desktop (15.9%).
However, there are by far more conversions made on desktop (74.2%) than on mobile (11.3%).
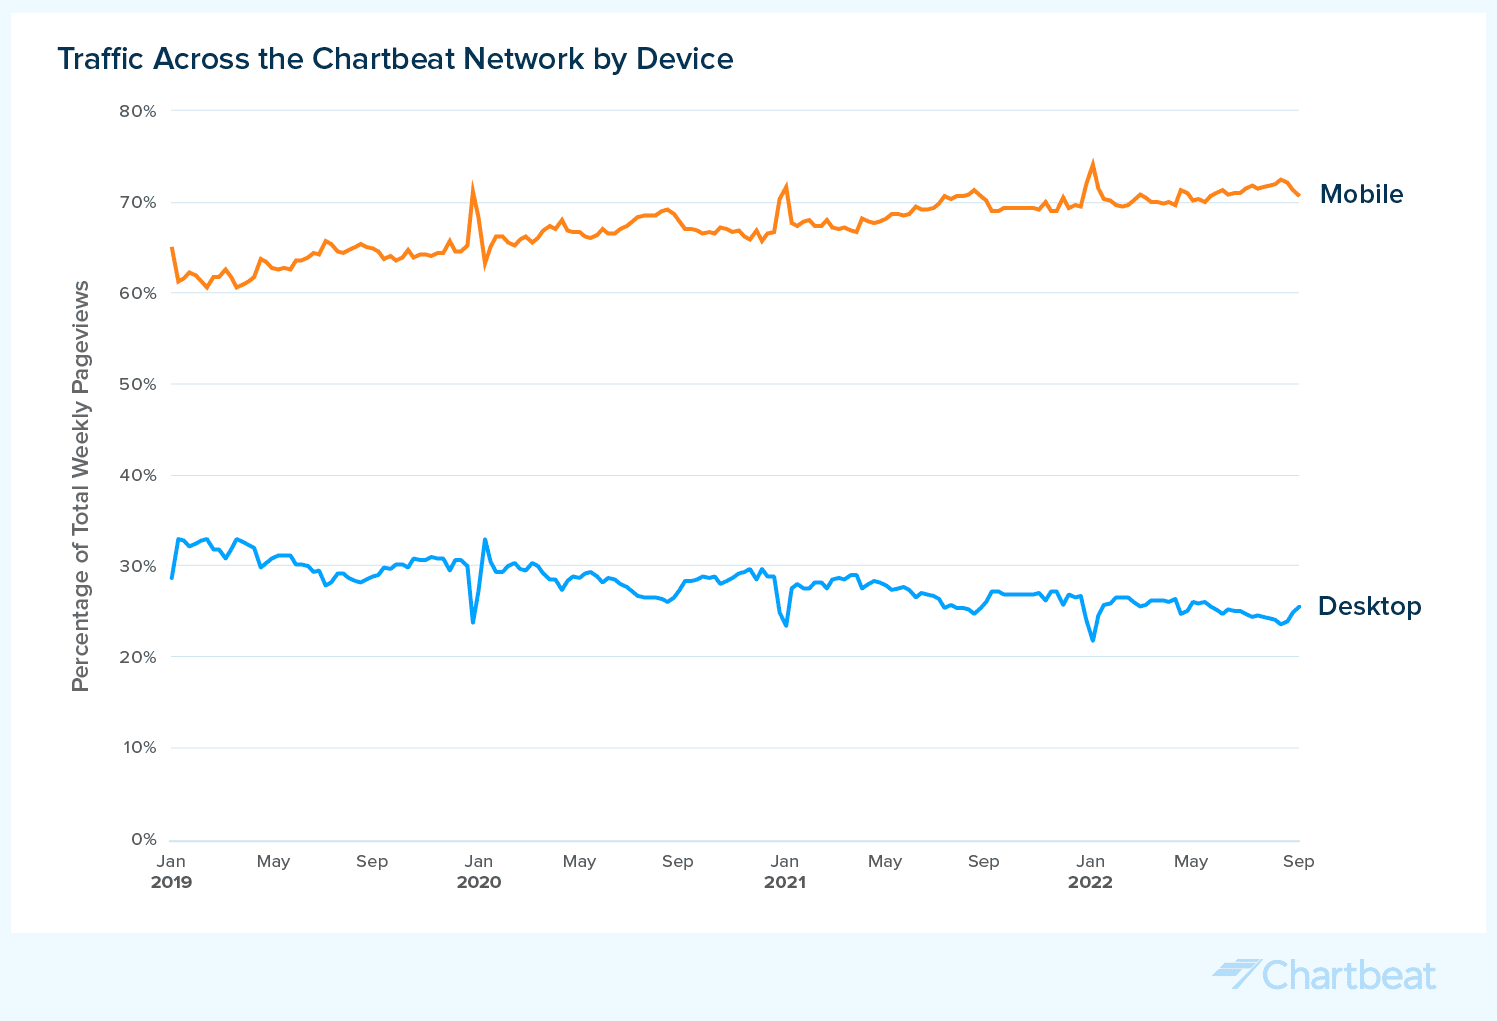
And Chartbeat’s data shows that mobile traffic is on the rise…
Optimizing conversions on mobile is therefore becoming increasingly important. Hence why we recently published an article on the topic - available here.
The takeaways:
- Don’t overlook the context of consumption based on device
- Consider employing a different strategy for mobile users, focussing on engagement (such as newsletter subscription or registration) rather than subscription
- Optimizing the user experience, using triggers for personalization and adapting the paywall design for mobiles are also essential
1 subscriber or 48,000 page views?
Calling all publishers employing both a reader revenue and advertising monetization model: Would it be more valuable for an article to generate a high number of page-views or successfully convert a user into a subscriber?
It’s an important question. Why? Because the entire company should be aware of exactly what brings the most value to your business.
For journalists, continuously comparing the potential revenue gained from each article through ads vs subscriptions is how they’ll know whether it’s more valuable to write for clicks or for conversions.
The 2 key metrics for unit economics:
- CLV (Customer Lifetime Value) → measuring the value of subscribers
Average customer value x Average customer lifespan
Say we charge an average of $9 per month for subscription and, on average, these users remain subscribed for 20 months, then the CLV would be $180. Concretely, this means that each new subscriber will (again, on average) bring $180 to the company.
You can also take into account customer acquisition costs - divide CAC by the number of customers acquired per month.
2. Digital advertising revenue per 1,000 impressions (RPM) → measuring the value of advertising
(Revenue ÷ Impressions) x 1,000
Say we want to calculate the RPM for September 1st, 2022 when the site earned an estimated $133.04 for 104,752 ad impressions…
RPM = ( 133.04 ÷ 104,752 ) x 1,000
RPM = $1.27
An important precision for journalists - not every page view generates the same amount of ad revenue and it’s highly dependent on context, device and the quality of data available. You can therefore track RPM for programmatic advertising only, and just for content pages alone (not the home page for instance).
Putting these together:
As an example, let’s say we have:
- $345 Average CLV
- $7.16 programmatic ad yield from 1,000 page views
- 4,248 Average Page Views per article
- 128k Page Views from the highest performing article
This means that:
- 1 subscriber is worth the same as 48,000 new page views
- 1 new subscriber generates more than the ad revenue from 10 average articles
- Ad revenue from the most popular article is the same as revenue from just 2.6 subscribers
The takeaway: measuring and comparing these two metrics, noticing the value of subscription vs advertising should drive key decisions about content, encouraging journalists to write for conversion over clicks.
Personalize newsletters to maximize on engagement
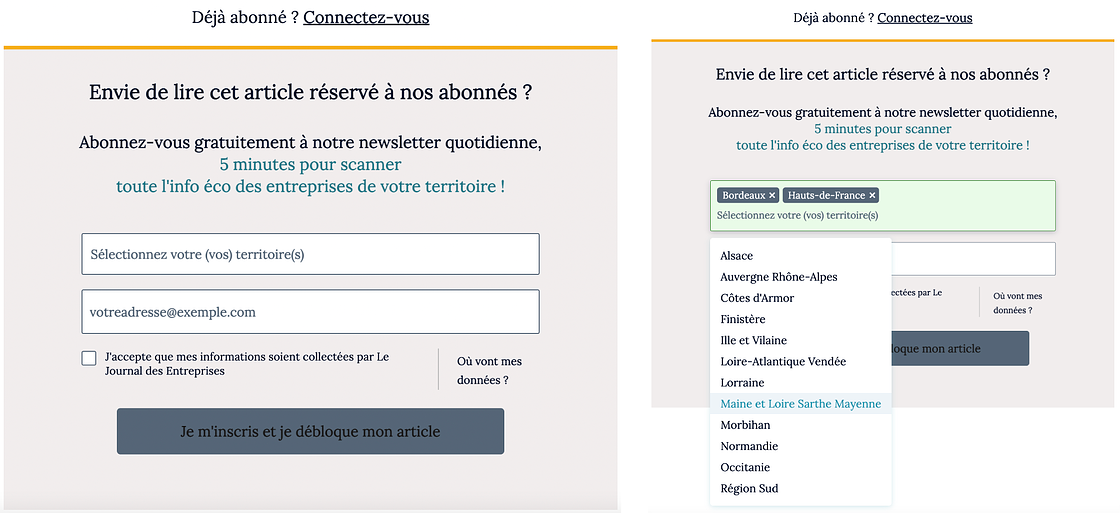
Use case: Le Journal des Entreprises
Newsletter walls ask users to sign up to your newsletter in exchange for access to content. They’re a brilliant soft conversion step prior to the paywall to increase engagement and propensity to subscribe.
JDE has gone a step further in allowing readers to personalize the newsletter content by selecting the region(s) that they’d like to hear about.
More personalization = higher engagement (recency, frequency & volume of visits) = increased revenue from both advertising and subscription
Final note to share some very exciting news
Yes, I know, we’re the ex-newsletter who no longer shares news, but we couldn’t not talk about these:
- Poool are sponsoring Media Moments 2022, bringing together the key events which shaped the publishing industry this year, from the boom and bust cycles of advertising markets to news fatigue, the increasing prominence of climate coverage, and (of course) the rise in subscription and membership models. You can pre-register for free here!
- Last week we announced that Poool fundraised 4 million euros for our Membership & Subscription Suite! Our goal is to put this to use in further developing our products, reaching publishers in more countries around the world and supporting other verticals, including brand publishers who need tools to turn their content into business. Find out more in our press release.
- We have some very VERY exciting news coming next week! I’ll give you a hint - it’s like this newsletter and our blog, but much MUCH better… Keep an eye on our LinkedIn, but I’ll make sure you’re the first to hear about this and get to benefit as much as possible ❤️
I'll be back next week to let you in on our secret!
Until then, have a great week:)
Best, Madeleine