

A special newsletter as we launch our very first Conversion Funnel Benchmark report.
Compare your conversion performance to market averages thanks to our aggregated, anonymized collection of data points, presented in an actionable way to better convert users into subscribers.
Download the report for free here, or check out our 5 key takeaways below (or do both 😉)
1. Increasing paywall conversion rates starts from the moment a user arrives on your site
The process of converting users into subscribers involves a lot more than just clicking through the paywall and paying.
The reader needs to find your site (acquisition), become increasingly more interested (engagement), see your premium content and be frustrated enough by the paywall to decide to convert.
These final two steps involve the visibility of your premium offer & paywall, and are the often-forgotten, essential steps to optimize in your subscription strategy.
- Premium content visibility: the percentage of users on your site who visit a premium content and have the potential to be exposed to the paywall
No. of readers who visit a premium content / Total no. of visitors to your site
- Paywall visibility rate: the percentage of users who visit premium content and also see the paywall.
No. of readers who see the paywall / Total no. of visitors to premium content
If a user never visits premium content and never sees the paywall, there’s 0 chance that they will convert via this paywall. An effective paywall strategy therefore starts by focusing on these first 2 steps in the funnel, moving users towards the wall to force a buying decision.
2. Specialist media have the highest premium content and paywall visibility rate
With 85% average premium content visibility and 74% paywall visibility, specialist media lie at the upper quartile compared to all publishers in the study (including news media, B2B, daily regional, and digital-only).
.png?width=1120&upscale=true&name=Premium%20content%20visibility%20rate%20(1).png)
.png?width=1120&upscale=true&name=Paywall%20visibility%20rate%20(1).png)
These specialist publishers have a very niche content focus, often leading to a highly engaged audience who have above average frequency and volume of visits. For this reason, tighter paywall strategies can prove more effective as the higher engagement counteracts the frustration.
For other, non-news publishers, this highlights the value in finding a niche or producing content ‘series’ and sections focused on a single area to attract consumers who are interested in that particular topic and will more likely become engaged enough to convert.
The value of this strategy is proven in the next set of results in the study, revealing the average click-through rate for specialist media as also being above average, at 1.99%, compared to 1.3% overall benchmark.
3. Publishers are employing increasingly tighter paywall strategies (2019 - 2023)
Poool ran another study in 2019, The Digital Media Review, tracking similar metrics across 75 French publishers.
The results showed that traffic on premium content averaged at only 21.3%. This figure has reached 56% in the 2023 report.
Equally, paywall visibility rate (i.e. the percentage of traffic who see the paywall) stood at 27.7% in 2019, but now averages at 29.12%.
This suggests that publishers are blocking increasingly more content with a paywall, placing these premium articles higher up on the homepage and configuring paywalls to block more text.
This isn’t too surprising. Since 2011 when The New York Times introduced their metered paywall model, offering 20 articles for free per month, increasingly more publishers have been following suit, employing a digital subscription strategy with a paywall to increase conversions. Today, The New York Times only offers 1 article for free, and even that is blocked by a registration wall.
4. The visibility of your paywall on a premium article impacts conversion rates, but there’s a balance to find
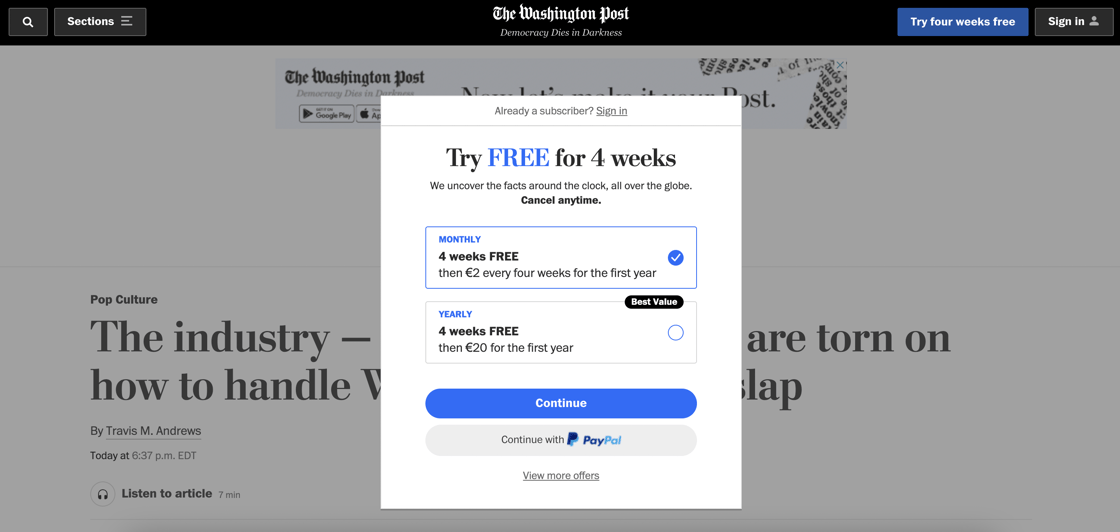
The report highlights the vast diversity when it comes to paywall visibility rate - i.e. how much of the article is blocked by the paywall. The lowest example in the study is at 15% whilst the highest lies at 85%, however there are plenty of examples on the market (such as The Washington Post) where publishers block all content, making for 100% paywall visibility rate.
As the study suggests, A/B testing is the only way to find the optimal paywall visibility rate for your publication.
They recommend that you should:
- Test wall placement, putting it at different points on an article based on the content type - e.g. leave more of the article open for general news content compared to opinion pieces
- Employ a different wall on mobile devices where the wall is seemingly further down the page than on desktop
- Optimize the order in which scripts are called to the page to configure a wall to appear sooner in the case of a bad connection
- You could also consider testing paywalls that block in a different way (full screen, pop-up or anti-scroll wall)
- Allow journalists to configure the placement of the paywall in their CMP to better adapt paywall visibility to the storytelling involved in their work (employing the hourglass framework, for instance)
5. Regularly modifying the paywall design will have a significant impact on paywall conversion rates
To avoid paywall fatigue, the report highlights the value in regularly updating the paywall design, making sure that those users who continuously pass through the other steps don’t become blind to the wall.
For instance, this publisher in the study saw click-through rates increase every time they altered paywall design:
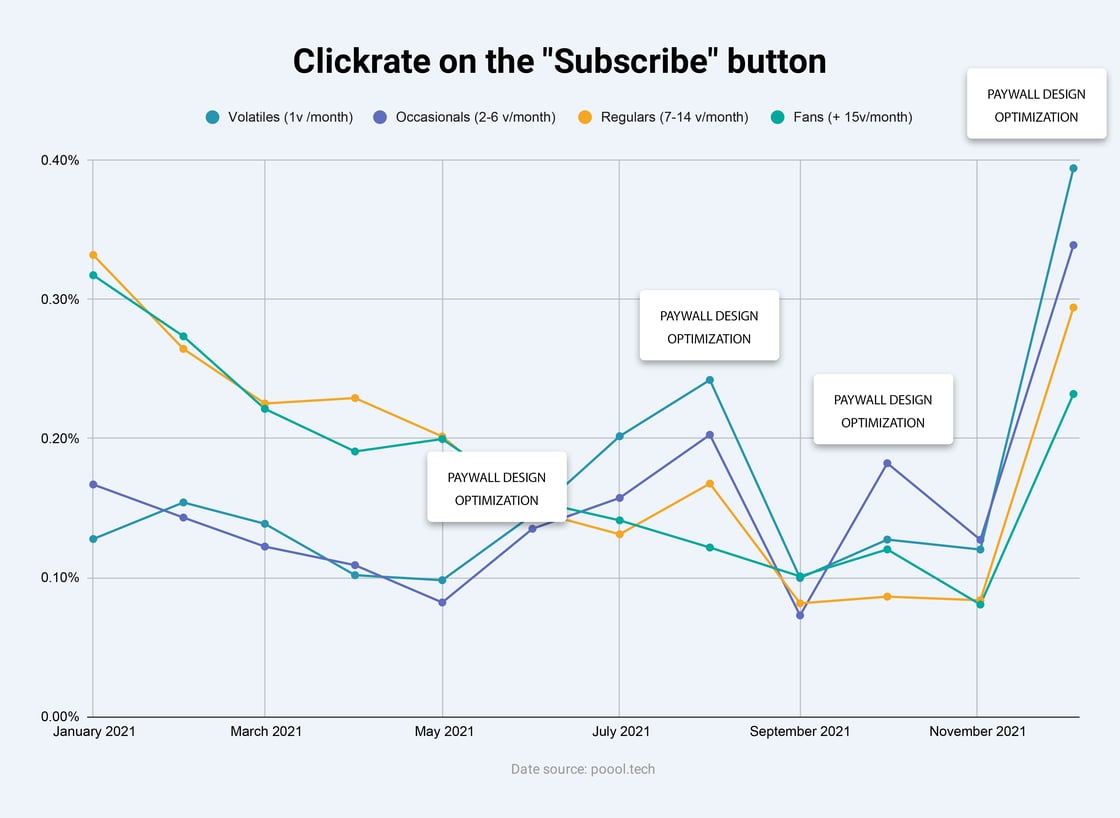
As the report shares, one of the most valuable and effective strategies to optimize paywall click-through rate is a dynamic model, one where the wall adapts to the user’s profile or context.
How can the wall adapt?
- The design: colors, images, photos of journalists, format (banner, box or pop-up)...
- The offers (annual vs monthly pricing, discounted offer, number of offers on the wall…)
- The wording (value proposition, personalization to the person or the content-type…)
What could the wall adapt to? (i.e. the reader’s context or profile)
- The content type (is this wall on an article talking about general news or politics?) e.g. the content is telling you key information about the reader’s interests, so use this to your advantage in writing an adapted value proposition
- The source of traffic (did this user come from a newsletter, social media, a partner…?) e.g. users coming from a news aggregation site may not yet be aware of the value you offer, so you could consider leading them through an adapted soft engagement journey, just like Journal du Dimanche did with upday
- The reader’s location, e.g. The Guardian’s personalized messaging says “you’re joining us from France”
Download the full report here or check out the webinar launch event where we answered audience questions.
This report is part of a new Poool project to share benchmark insights with clients to better support them in optimizing their user-to-subscriber conversion rates. Each quarter, results from our study will be released in the form of a report, webinar and integrated into the Poool Dashboard.
Although this report is available to the general public, it will be reserved for Poool clients in the future.
Not yet a Poool client? We’d love to offer you a free demo of the Dashboard and a meeting with our consultancy team to discuss your current challenges, goals and how Poool can help you achieve them! Find a slot that suits you here.
All the best,
Madeleine