

A/B testing - the marketing equivalent of a game show where two versions of a campaign face off to see which one wins!
Whether it's web design, email marketing, or product development, A/B testing is a powerful tool that helps businesses optimize their strategies. By comparing two versions of a variable, this user-friendly testing method provides valuable insights into customer behavior, allowing businesses to make data-driven decisions and increase revenue in the ever-competitive digital landscape.
For publishers with a subscription or membership strategy, A/B testing is crucial to improve engagement, click-through rates and conversion rates. One publisher well aware of this is The Africa Report who have been using Poool’s A/B testing features to optimize their reader revenue strategy, analyzing performance in the Poool Dashboard.
The outcome?
- The Africa Report increased their database thanks to a newsletter wall, which also proved an essential tool for audience engagement
- The publisher almost doubled their number of subscribers
In this article we’ll dig into how The Africa Report's team, worked together with Poool’s consultancy to improve their subscription strategy - the different A/B tests they decided to run, the KPIs that mattered for them and how they analyzed performance.
I. Which A/B tests did The Africa Report choose to run?
The Africa Report ran three different tests, working both on their user journey (i.e. the type of wall that their users would be faced with) and their paywall (i.e. wording and design).
1. A/B testing reassuring messaging
Hypothesis to test: Does reassurance influence CTRs?
Variable: Adding a “cancel anytime” text to the paywall
Goal: Increase click-through rates across all audience segments
Control (Classic Version): paywall without reassurance text
Treatment (Test 1): paywall with a “cancel anytime” test under the CTA
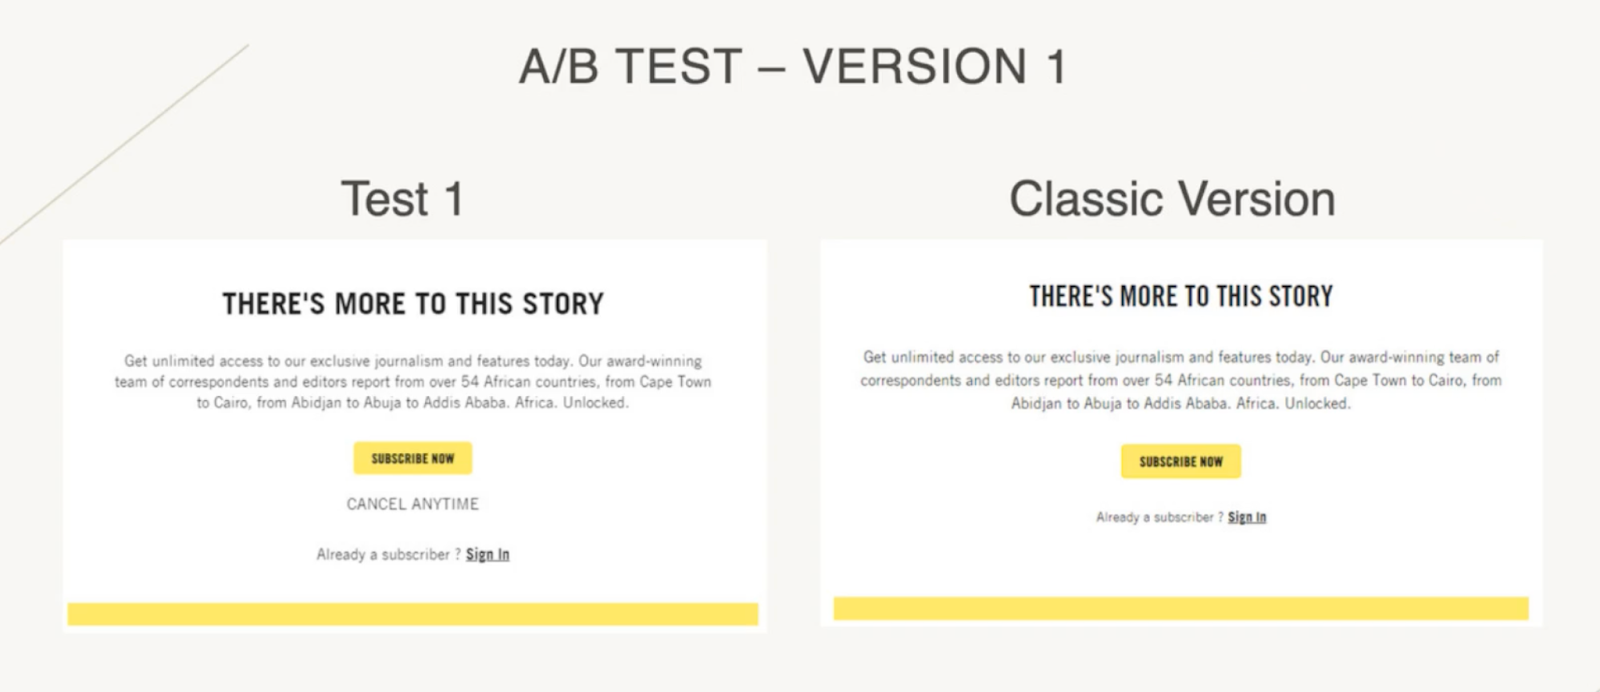
Results: The treatment (test 1) had a significantly higher CTR than the control wall. Because of these results, the treatment version became the default version for the other tests launched (this version was then named the “new classic version”).
💡Top tip: Building a trusting relationship is vital for high conversion and retention rates, and paying for a subscription is a friction point in the user journey. Reassuring your readers by highlighting a key feature like "Cancel anytime" or including a link to contact support teams if needed helps build that relationship, because users feel they aren’t bound to their subscriptions.
2. A/B testing offers
Hypothesis to test: Does integrating offers into the wall improve CTRs?
Variable: Integrating subscription offers into the paywall
Goal: Increase click-through rates across all audience segments
Control (New classic Version): paywall with a CTA “subscribe now”
Treatment (Test 2): paywall incorporating two offers with detailed benefits (a monthly and an annual plan)
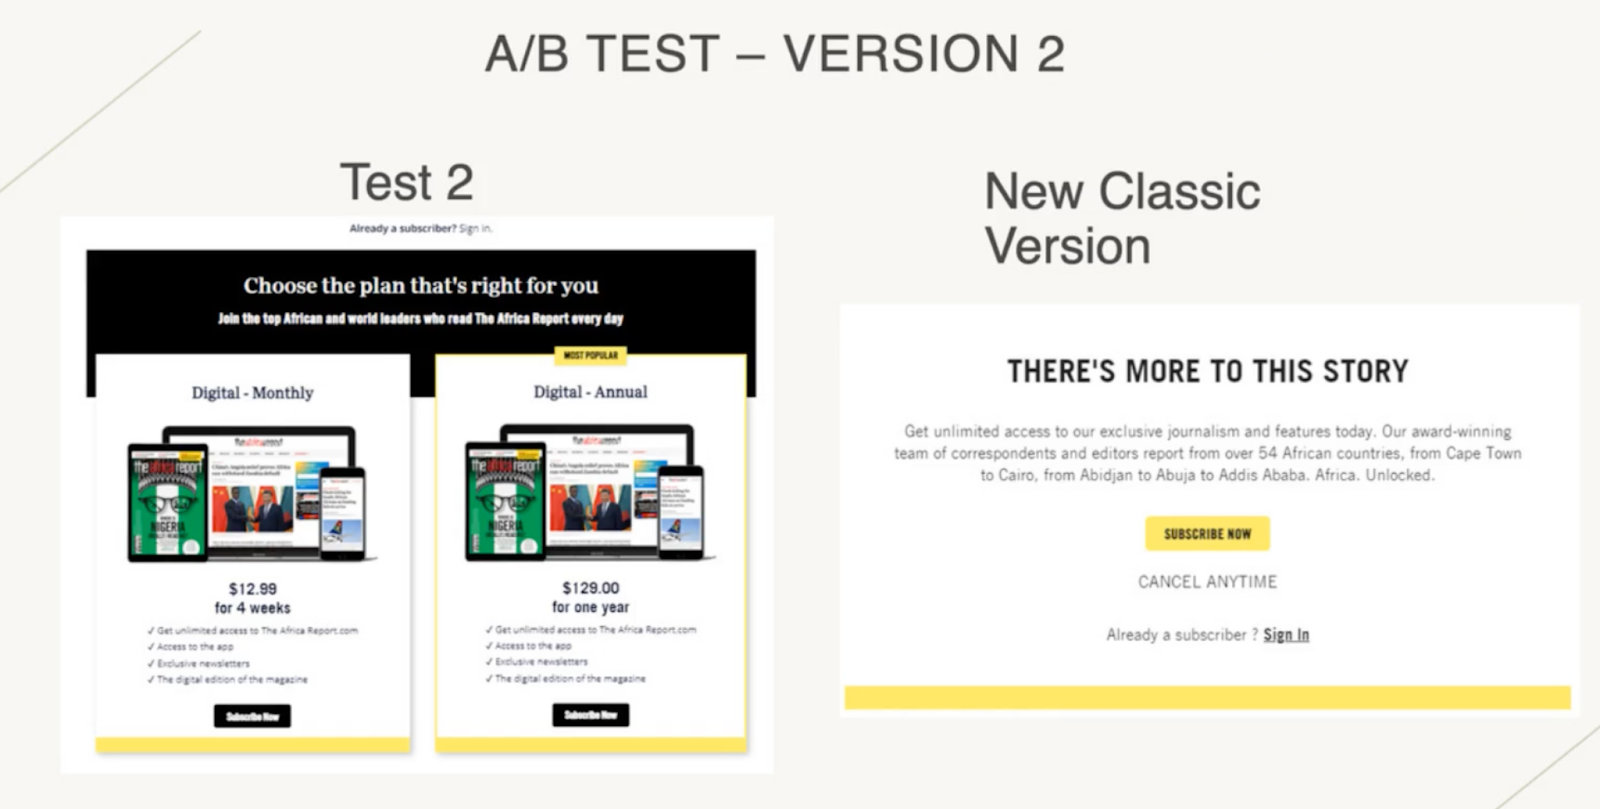
Results: The control (“new classic version”) worked better than the treatment (test 2).
💡Why? Their team believes that the treatment paywall included too much information, making it heavier and less attractive for users.
3. Testing soft conversion and targeted subscriber acquisition strategies
For the third test, The Africa Report’s team wanted to implement a newsletter wall into the user journey to collect key data points, increase engagement and target this audience via emailing, Google ads or Facebook.
Hypothesis to test: Can a newsletter wall increase their known audience segment?
Variable: a different wall type (newsletter wall prior to the paywall)
Goal: Increase The Africa Report’s known audience, collecting their email address to then target them with personalized campaigns
Control (New Classic Version): paywall alone
Treatment (Test 3): newsletter wall prior to the paywall
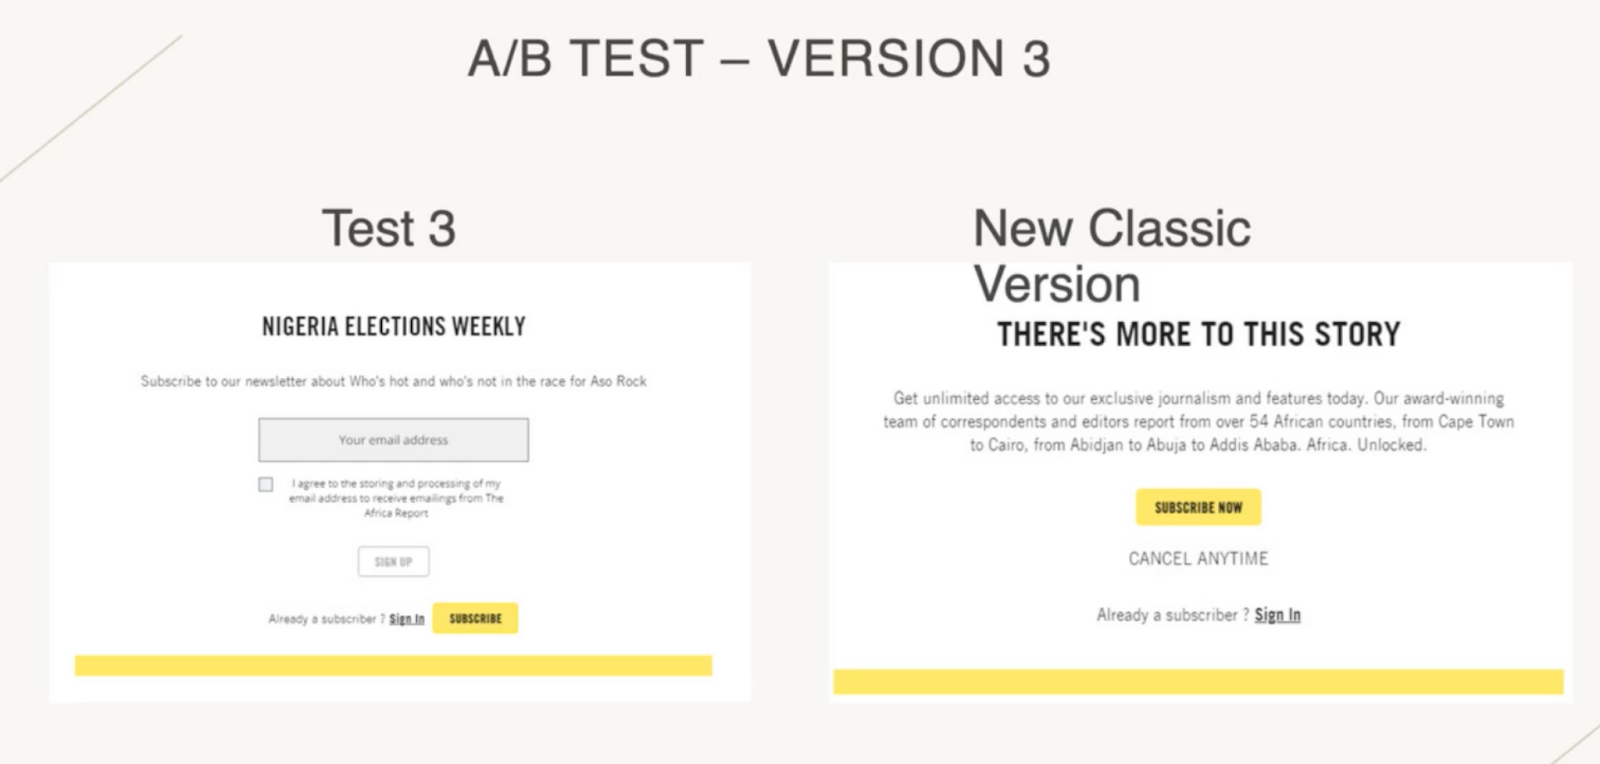
Results: This test was a success. First, in just a week, their team had gathered more than a thousand emails. Second, this soft conversion step prior to the paywall led to an increase in user-to-subscriber conversions, supporting their overall reader revenue model.
💡Top tip: Using soft conversion steps such as a newsletter or a registration wall has a significant impact on conversion to subscriptions.
II. How did they analyze their performance?
1. Choosing the KPIs that matter
The main KPI for The Africa Report is the number of wall impressions. From this main KPI derives a secondary KPI: CTR. Their paywall CTR averages 2.70%, which is higher than market averages.
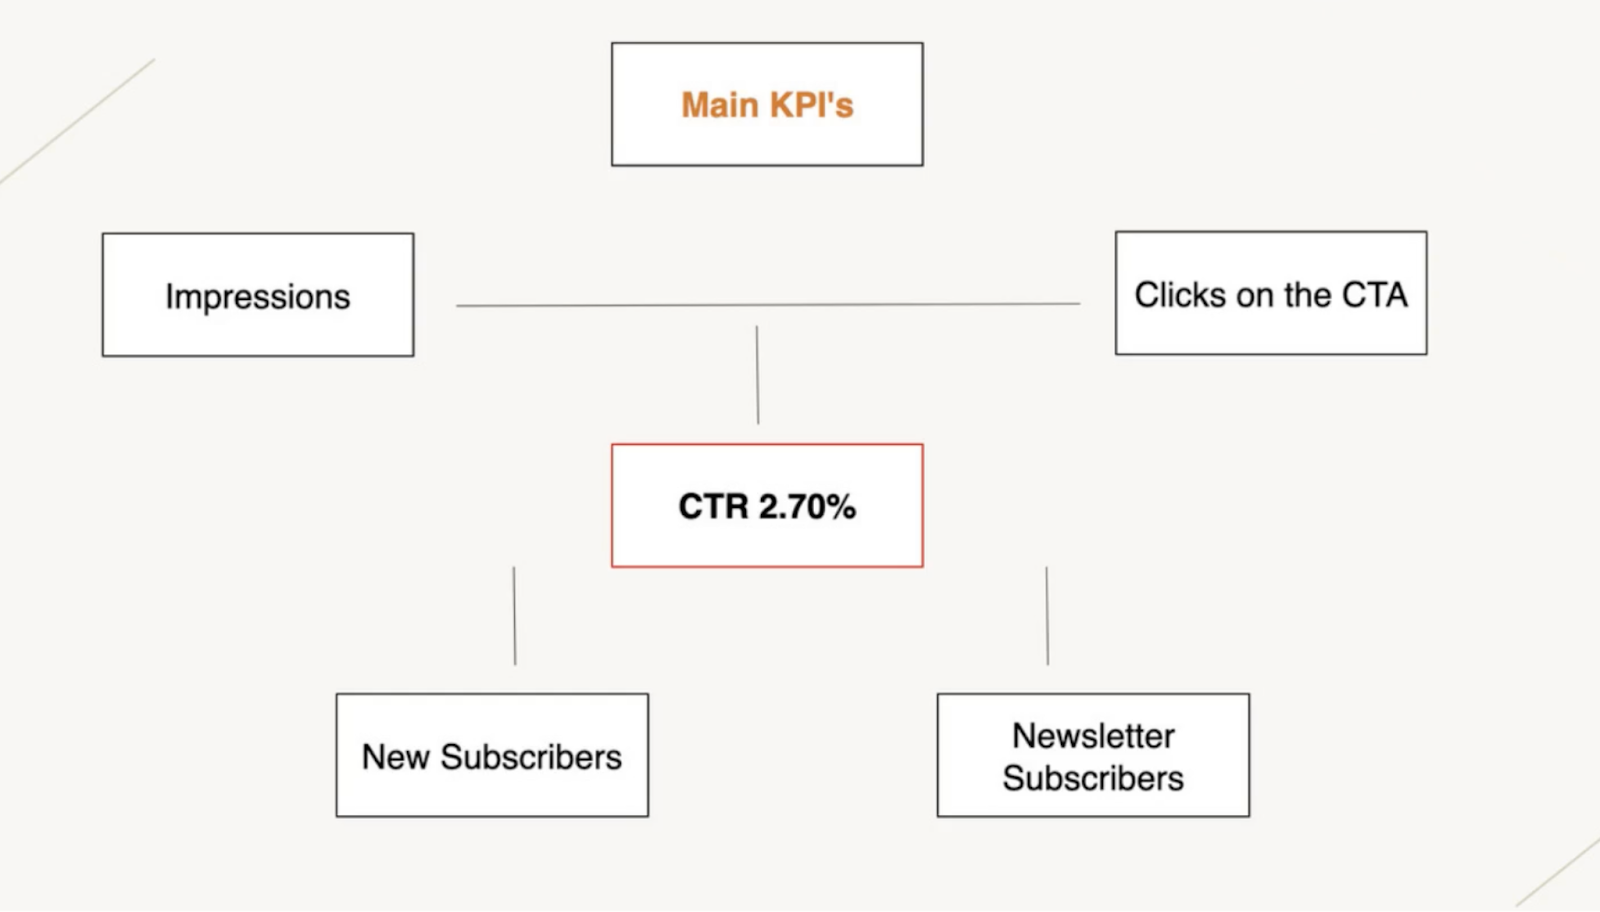
Though the CTR is an essential metric to monitor, it is only one step towards the end goal: conversion. This conversion can be a free subscription to the newsletter or a paid subscription.
Working together with Poool’s consultancy, The Africa Report managed to almost double their paid subscribers!
A part of that success lies in continuously monitoring and analyzing performances. Luckily, the Poool Dashboard provides publishers with an easy-to-use tool to do just that: the Analytics section.
III. Analyzing results in the Dashboard
1.Evaluating performance over time
The Africa Report’s team analyzes their strategy’s results on a weekly basis, publishing findings in a report. The Dashboard provides analytics over a time period that marketing teams can personalize, whilst The Africa Report team can use both weekly views and monthly time frames to decide and implement monthly, quarterly and yearly strategies.
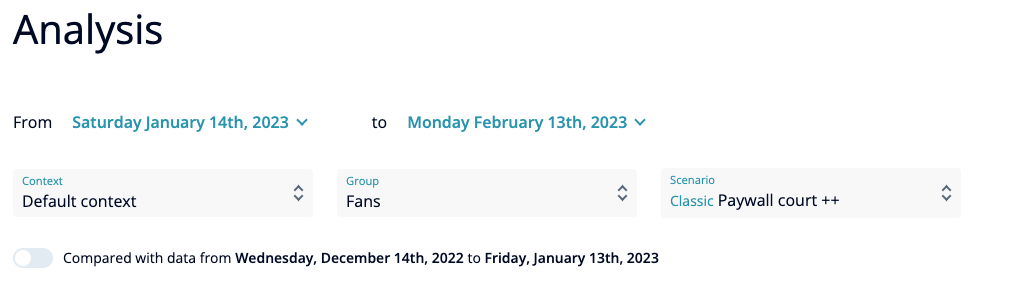
Publishers can set the time period as well as compare data from different periods in the Dashboard
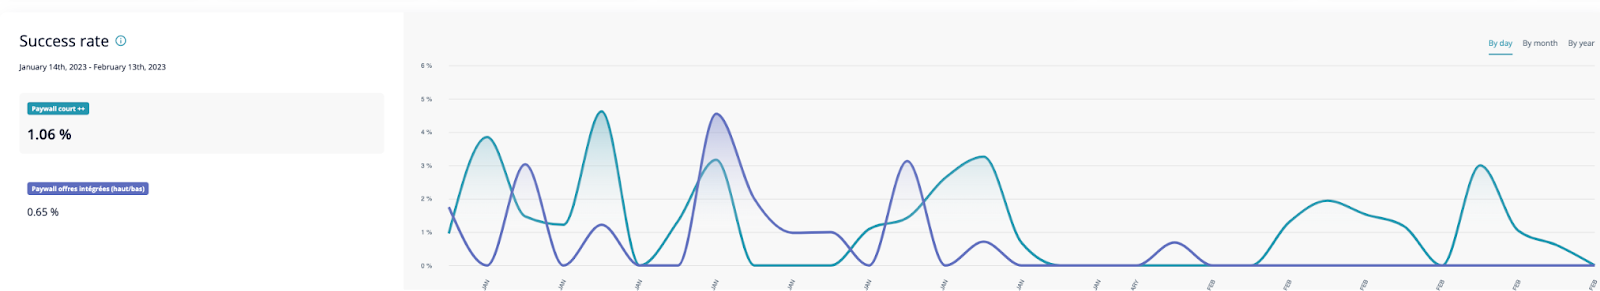
2.Comparing the performance of A/B tests
The Africa Report’s team can easily study the performance of their A/B tests thanks to the “Success Rate” metric. This displays performance both in a percentage and as a graph on the Dashboard, showing the two variables on the same graph.
3.Breaking down the data
The Africa Report’s team used both the subscription and the newsletter walls. Poool’s Membership & Subscription Suite provides publishers with 10 different conversion options, enabling them to set up scenarios adapted to their audience and business goals.
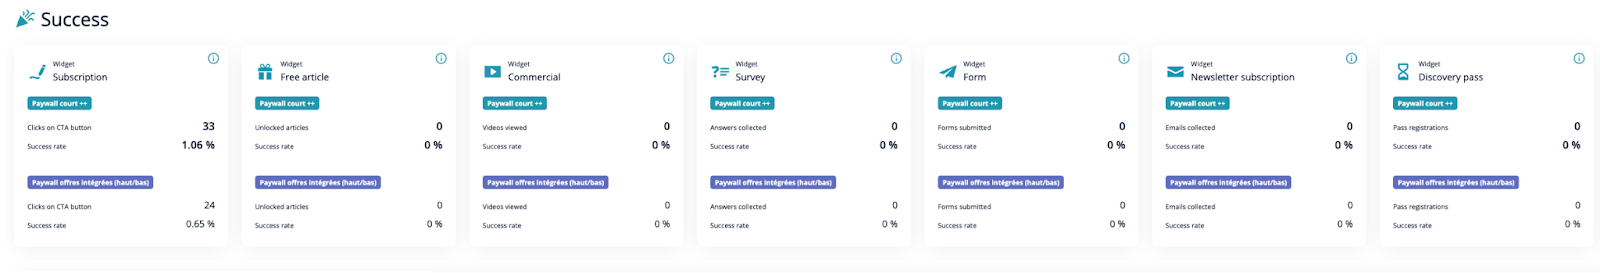
Publishers can analyze the performance of each conversion wall individually as well as overall. They’ll then be able to understand which part of the user journey performed better and link their strategy’s success to the performance of a particular wall.
Interested in implementing a successful subscription strategy, just like The Africa Report? Poool have a simple, flexible platform to allow you to do exactly this, and without the need for tech support at every turn!
Book a demo