

Being a data-driven business is the key to success in today's digital world. It puts you in a very strong position for making informed decisions based around your audience's behavior in order to optimize the user experience whilst maximizing ARPU.
A simple but extremely effective way to be data-driven is through A/B testing. Through trialling out different versions of the same webpage, you can understand exactly what works well with your audience and what doesn't.
And this is no different when it comes to paywalls and conversion funnels. By testing various aspects of the user’s journey to subscription or registration, you can find the variation that leads to the highest conversion rates which, in turn, will bring you the most revenue.
A/B testing is therefore hugely valuable and should be a part of every content producer's strategy for paywall success and conversion rate optimization (CRO). Even a simple test on a hypothesis can result in significant benefits for your business as well as invaluable learnings about your audience.
In this white paper, we’ll provide you with the foundations to get you started with A/B testing, including:
- What is A/B testing?
- What’s the general process for carrying out an A/B test?
- Essential guidelines for your A/B tests
- What can you test?
- Useful resources for your tests
“Our success at Amazon is a function of how many experiments we do per year, per month, per week, per day…” - Jeff Bezos, Amazon
1.What is A/B testing?
A/B testing, or split testing, is a marketing technique that works by comparing the performance of two versions of a single variable (such as scenarios, wall layout, colors, copy) to discover which leads to the highest conversion rates. The variant being tested is called the ‘control’ whilst the variant that is argued to give a better result is called the ‘treatment’.
Before launching, you’ll be able to create the two versions within your chosen user segment as well as configure what percentage of your audience will be presented with each (e.g. 50-50, 20-80, etc). This means that whilst one user might see the control, another will see the treatment, without them even being aware that their behavior is being analyzed.
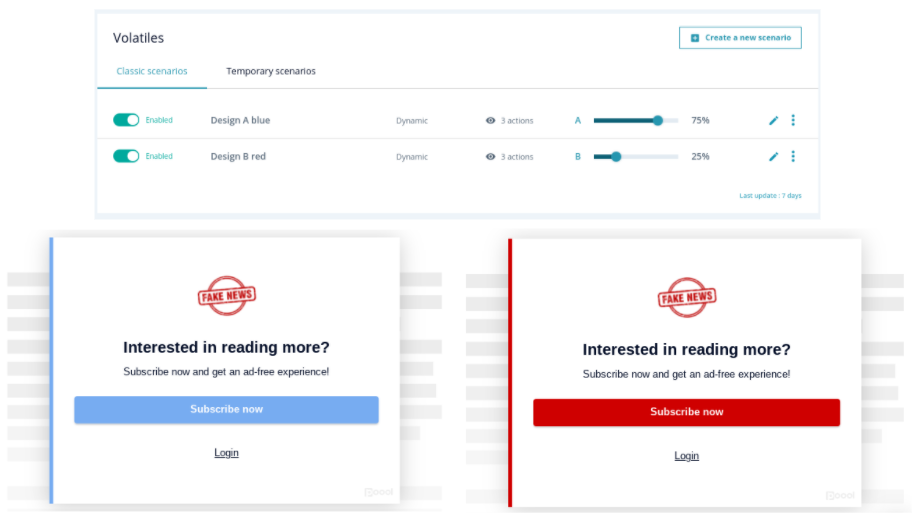
The image below, although an oversimplified example, demonstrates how A/B testing works. Here, we’re carrying out a test to see whether the color of the wall has an impact on the click through rate (CTR). Our hypothesis is that the red design will outperform our current blue design as it matches our logo and house style. We are therefore trialling this new version out on 25% of our volatile audience segment. The results proved our hypothesis, showing that the red design led to a higher CTR than blue.
Benefits of A/B testing:
- Increased conversion rates through optimizing the subscription funnel
- Increased revenue from the additional subscribers
- Improved user engagement and experience because you're adapting the wall based on their behavior
- Learn about your audience to inform your strategy in every aspect of your business
- User-friendly optimization method (easy to test)
- You can test pretty much anything
- Cost-effective (especially when the A/B testing system comes as a part of your paywall solution *pst this is what Poool offers! Try a free demo here!)
- Quick, actionable results from even a small test
- Very low risk
Overall, running tests is a simple, inexpensive and user-friendly optimization method, extremely useful for learning how to generate leads and convert more visitors into registered users or subscribers. Given this, if you’re not yet A/B testing then you’re missing out on a valuable opportunity to grow your company and turn your audience into business!
Note that the label ‘A/B test’ is a generic term given to any test used, whether they are indeed an A/B split tech, A/A test, multivariate test (MVT), etc.
2. What’s the general process for carrying out an A/B test?
- Analyze (this is where you're trying to find the problem areas - it's the general starting point where you can gradually find a very specific feature to test) - e.g. A study of paywall usage statistics
- Work out the problem (make sure to identify a very specific problem, avoid being too general such as 'we don't have enough conversions') - e.g. there isn't enough traffic in the subscription tunnel amongst the most loyal readers
- Form a hypothesis (again, specificity is key. Utilize your data to define a hypothesis based around a single variant that you can test) - e.g. the journey used for readers to discover articles is too long
- Define the KPIs to measure (as we'll explain later, you should choose one macro and one micro conversion KPI to track) - e.g. click through rate in the subscription tunnel and conversion rates
- Define variant A (the original or control version, i.e. what you have now) - e.g. a discovery journey made up of 7 steps
- Define variant B (the treatment, i.e. what you think will work better and solve the problem) - e.g. a discovery journey made up of 5 steps
- Run the A/B test - e.g. put the 2 journeys in action for 3 weeks on the ‘loyal users’ audience segment
- Analyze the results - e.g. the variant B test generated 17% more traffic in the subscription tunnel, with a statistical significance of 95%. This means that the A/B test was reliable in 19 out 20 accounts
- Make decisions (based on what you've learnt) - e.g. implementing the journey that out-performed the other (variant B)
- Documentation (this helps to clearly see what you've learnt, enabling you to apply this knowledge to future tests and decision-making) - e.g. build up a document with the description of this test including such things as the length, settings, variations, results, etc.
3. Essential guidelines to follow for your A/B tests.
Although A/B tests can prove hugely beneficial for increasing conversion rates and therefore boosting your revenue, they can have an inverse effect if poorly executed. So, we put together this list of guidelines to take into consideration before starting your tests ensuring you succeed in your testing endeavours!
- Work from a hypothesis
As a data-driven optimization method, testing should be carried out based on an underlying theory or informed hypothesis that you have. Although testing can confirm or disprove a hypothesis, it can’t create one - this is your job prior to launching the test.
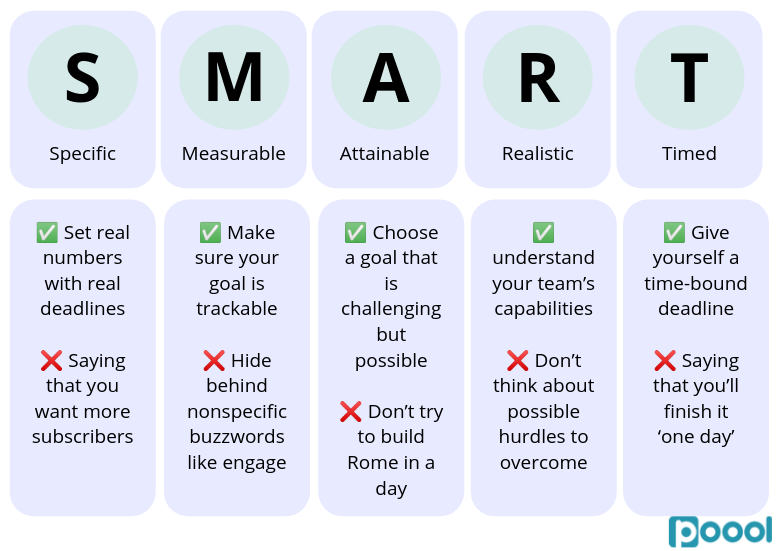
The simplest place to start is to build your hypothesis as a SMART goal: specific, measurable, attainable, relevant and time-bound.
- Only test one variable at a time but test the right variable
Although you may carry out multiple tests simultaneously on different user segments, especially after becoming more at-ease with testing, it’s important that each test involves only one variable at a time. Let’s say you try out different wording and colors within one test, how will you know which aspect of the wall improved conversions? It may even be the case that the wording did improve conversion rates but that you won’t see this in the results because the colors decreased conversion rates, equaling out the data.
This highlights how important it is to consider how you’ll measure success prior to carrying out your test. If you can’t study results and come up with clear conclusions about a variable then there’s little point in testing in the first place.
Having said this, when you test a specific element on a page, in the hope that it will have a positive effect on conversion rates, you can forget about a bigger problem that’s hidden elsewhere.
For example, changing the wording used on a button is a great idea for a test. However, this won’t be enough (or may even be counter productive) if, behind the wall, is a funnel that isn’t very effective. This is what we call maximum relative risk.
However, you can avoid this by identifying the easily affected elements to test first, based on your audience. For instance, the position of a paywall on the page, the length of the subscription process, number of stages in the tunnel, etc. Once these elements have been identified and understood, it’s recommended that you start with tests where you’re pretty much certain of the problem. This not only allows you to get your team onboard through proving the effectiveness of A/B testing but also means you can gain experience in order to start running more tests with increasingly more drive.
- Define your central and secondary KPIs before launching
We recommend choosing your KPIs in advance. Defining what you’re looking to achieve in each individual test will make analyzing and acting on results easier as you’ll be able to pick out the performance results that matter and understand how you can optimize your current wall to increase this KPI permanently.
What’s more, changing a part of the wall can sometimes have beneficial effects on one indicator but negative effects on another. So, defining which KPIs are important to you (primary and secondary) will allow you to dispel the other indicators that aren’t relevant to you in that test.
In terms of the type of KPIs to measure, you should choose one micro and one macro conversion indicator.
Micro conversion (soft) = a step in the funnel, such as a click, newsletter subscription, filling out a form, etc.
Macro conversion (hard) = this is the end goal that the micro conversions work towards, usually subscription for content producers using paywalls.

Micro conversion indicators should definitely be tracked, but optimization and testing should be carried out with the macro conversion goal in mind. So, whilst the macro conversion is what you’re ultimately aiming for, analyzing KPIs from both the micro and macro levels means that you can really refine the whole conversion funnel, understanding exactly what works and what doesn’t.
Note that if you’re limited to completing a test on only a small sample size, be sure to take this size into consideration when looking at indicators. For example, with a small sample, it could be more useful to look at traffic on your subscription offers page and the effect of variations on this page than to look at the number of conversions. This will mean that you’ll have a larger number of results to analyze and the test will prove more insightful.
For more information, check out Poool's Help Center articles on A/B testing.
- Don’t run too many tests simultaneously
With Poool, you can create an A/B test for each of your audience segments at the same time, providing a great opportunity for you to optimize your paywall strategy for each user profile.
However, it’s important to be aware that preparing and implementing an A/B test, not to mention analyzing and drawing conclusions from it, is very time consuming. If you don’t have the resources to do multiple tests at the same time, it’s better to prioritize one test over others and work through them one-by-one. Quality over quantity!
You also shouldn’t forget that, although you’re testing in order to optimize your website, there is the possibility that an A/B test will have a negative impact on your website due to a variation being less effective than what you’ve employed in the past. Consequently, there is a chance that all tests being carried out are having a negative effect and, when combined, will greatly impact conversion rates and therefore revenues.
This isn’t to say that you shouldn’t carry out multiple A/B tests simultaneously, but just be aware of the potential consequences and have an open mind about it. In particular, for low-traffic websites, restricting yourself to a single test at a time will limit your ability to carry out a large number of tests in a given period, given that the average length of a test is longer when traffic is low.
- Decide on the right sample size
It’s always recommended to test your variables on a large sample in order to get the most reliable and informed results. However, in order to work out the ideal sample size based on a specific factor, there are various online tools that can help. For instance, this Evan Miller website can tell you in just a few clicks what the optimal required sample size is for your test to ensure that it’s meaningful.
In general though, in order to reach a significant statistic index of 95%, you will need, among other things, a large enough traffic. Ideally this is a few hundred thousand visitors to your site.
- Don't leave your tests running for too long
Although you need to leave your test running for long enough to get a reliable result, you should also be aware that there’s a point where it can run for too long. Over-running a test could result in cookie data being deleted or expiring and could increase the risk of you losing value on Google.
Consequently, a negative effect of your test onsite could have a real impact on your search engine optimization and/or reliability of the test itself.
- Take into account external factors when analyzing results
Many external factors, that may change day-to-day, can have an impact on how people use your website. This can be simple things such as when they access your website, including whether its a weekday or weekend (this is important for B2B vs B2C companies), as well as more complex factors such as what’s happening in the world (e.g. Covid-19, presidential elections) or whether it’s payday or not. You will therefore need to stay aware of these factors and put any statistics into context before making business decisions following the analysis of A/B test results.
- Continue to optimize your website
Once an A/B test has finished, it will lead you to yet more hypotheses to be tested. This will allow you to develop a culture of continuous testing and improvement. A/B testing is a marketing technique that you can’t easily nor quickly out run!
It’s also important to not be disheartened by small or statistically insignificant results. These aren’t failures, they’re simply additional learnings that you can use to inform decisions and tests in the future. What’s more, small incremental improvements add up over time. So, even a test that leads to a slight increase in conversion rates, , will lead to significant improvements when combined with other tests with similar results.
4. What can you test?
In theory, you can test any aspect of your wall or part of the user’s journey towards converting. However, not all variables are worth testing due to their lack of relation to the KPIs that you’re interested in (usually click-through or conversion rates).
Although, when chosen correctly, variables can be tested in a variety of ways and prove hugely insightful into how your audience reacts to different walls and journeys. What's more, you don't necessarily need to implement huge changes to see results.
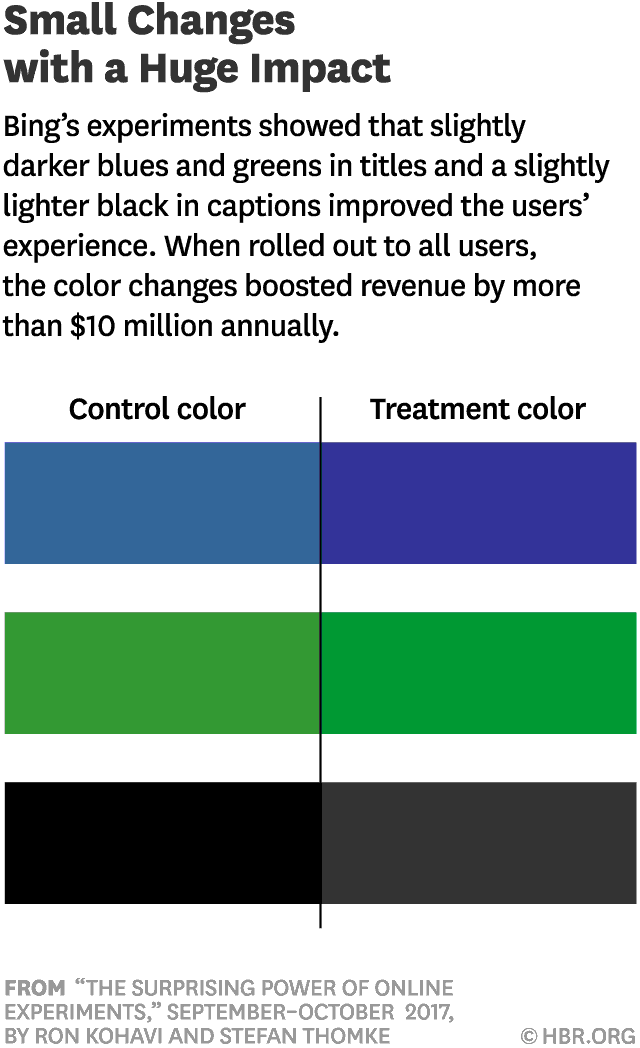
People commonly assume that the greater an investment they make, the larger an impact they’ll see. But things rarely work that way online, where success is more about getting many small changes right. Though the business world glorifies big, disruptive ideas, in reality most progress is achieved by implementing hundreds or thousands of minor improvements. - HBR
Taking small features of your wall to test is therefore the best way to incrementally improve your conversion rates and truly understand what works and what doesn't on your website.
Below, we’ll look at examples from 3 of the central areas for wall testing: the user journey, wall design and messaging on the wall.
Note that each of these variables can (and should) be tested on individual audience segments. A hypothesis that you have for one segment with a specific variable will likely not apply to another segment (e.g. whilst occasionals might turn away from a hard paywall that blocks as soon as they enter your site, fans and loyal users, who are the most likely to convert, may click through and subscribe).
Did you know that Poool’s solution allows you to A/B test scenarios, designs and wording with ease? Not to mention how you can perform multiple tests simultaneously in different segments, configure the percentage of your audience who will see each version and analyze results! Book a free demo here to see for yourself!
Test the user journey:
This could involve...
- The timing of when a user gets faced with a wall (e.g. after 3 articles)
- The placement of the wall on your site and on a page (e.g. midway through content or at the beginning)
- The wall(s) that are presented to users (e.g. just a paywall, or another wall before, such as donation wall, registration wall, survey)
- The timing of the fully blocking wall (when they can’t access anymore content)
- The number of steps in the user journey towards subscription
- What these steps consist of
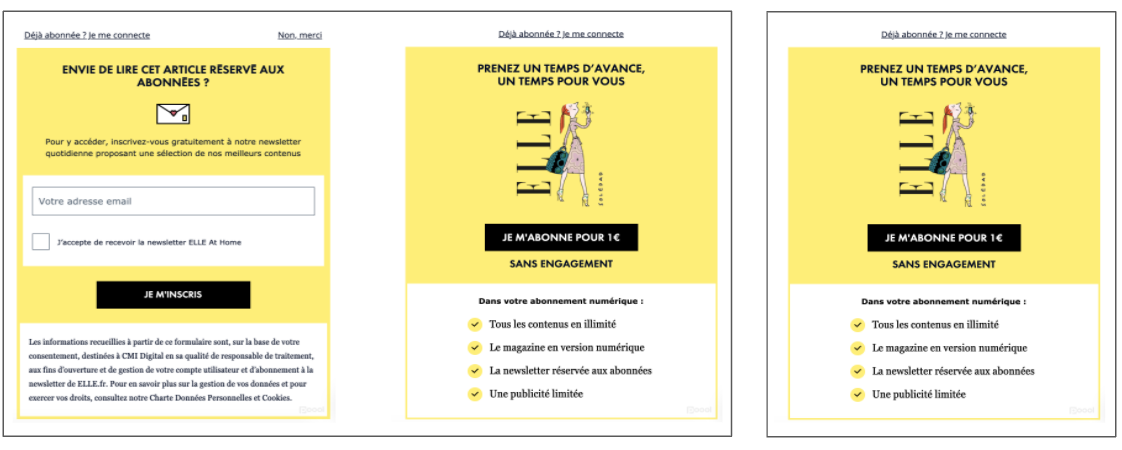
Example of ELLE.fr:
Here, two scenarios were tested. On the left, a newsletter registration wall as a first step before the paywall. The hypothesis here is that the first wall increases engagement and allows the publisher to identify the user, learning about their behavior in order to present them with a journey that is most likely to convert. As a control, we have B which is just a paywall alone.
How can you achieve this on the Poool Dashboard? (🔊 sound on!)