TL;DR
Tracking overall conversion rates is valuable, but it isn't suited to the publishing industry. Instead, it's highly more effective to split this metric into 5 steps, considering the entire user journey to subscription, tracking the smaller conversions in between each step. In this way, you work on making gradual improvements at each step of the funnel that will accumulate into a significantly higher overall user-to-subscriber conversion rate.
The conversion funnel
In general, when looking to increase conversion rates, we tend to focus on the conversion funnel, starting at the paywall and going through the steps to payment. And this does make sense, just not for publishers.
In fact, this optimization method derives from the e-commerce industry where buying processes differ greatly from a reader making the decision to subscribe. Specifically, e-commerce businesses see a lot of impulsive purchases, whilst a digital publisher’s conversion rates rely greatly on engagement prior to the paywall and conversion funnel. For this reason, it’s actually very difficult to optimize conversion rates by considering just the conversion funnel alone.
We can therefore consider an alternative and more effective way to analyze and optimize overall conversion rates for digital publishers by splitting the funnel into smaller steps based on a user's journey towards subscribing.
The new conversion rate framework
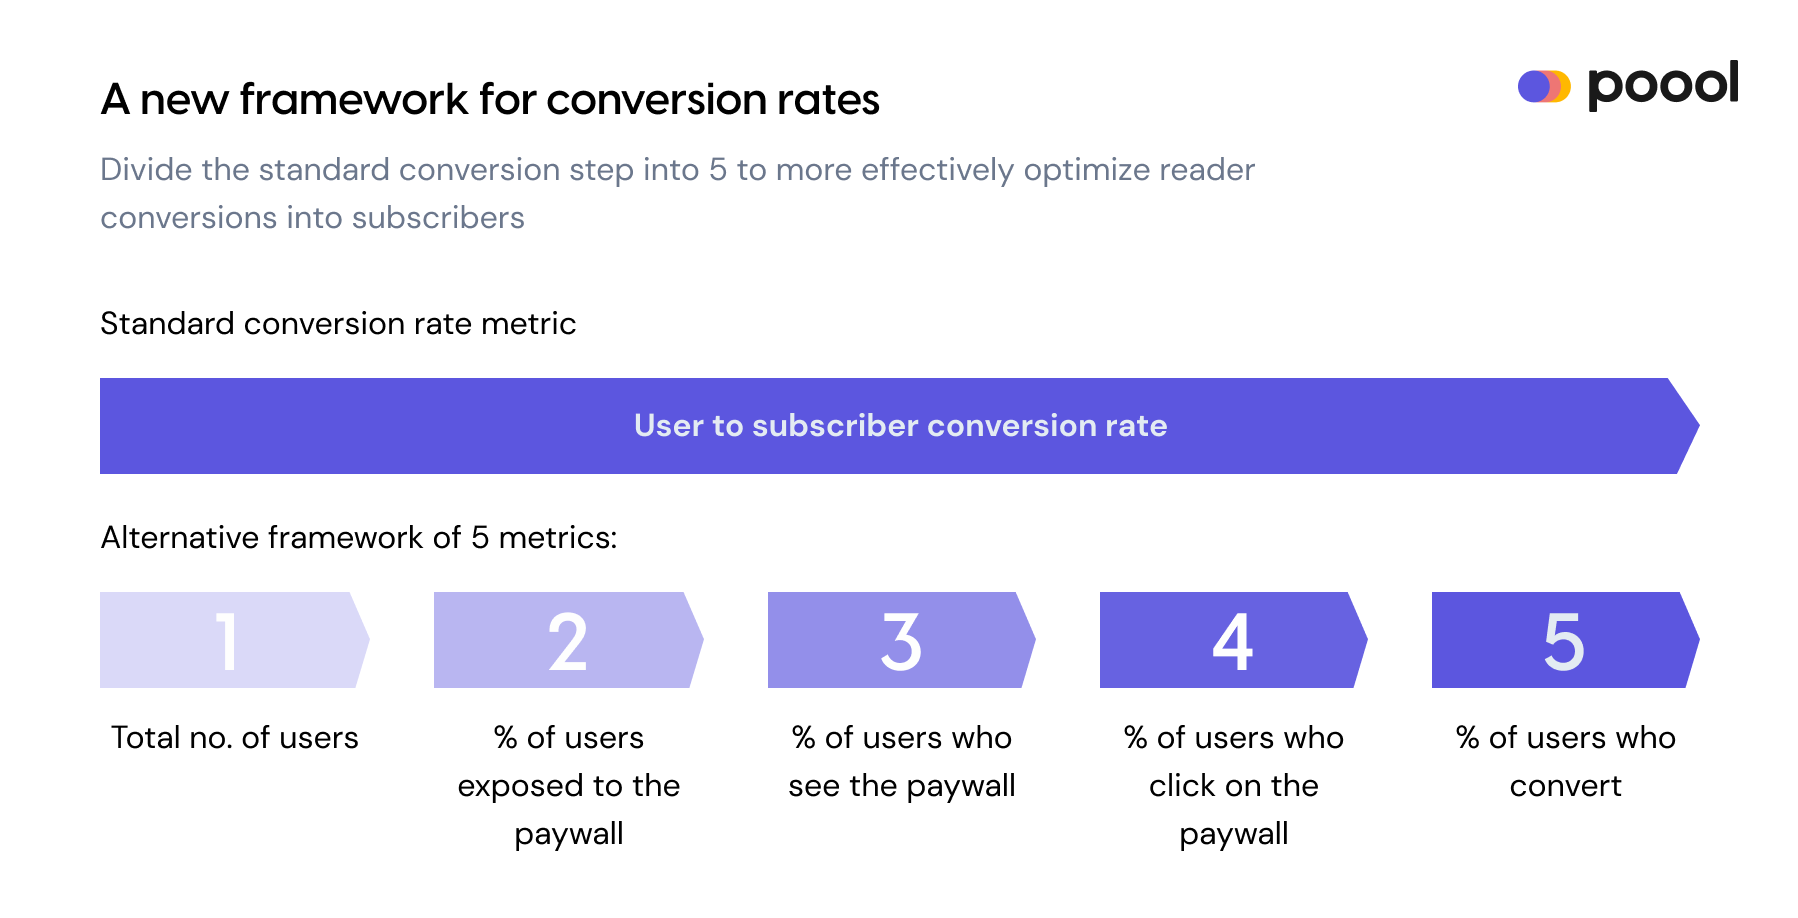
We propse a new framework, splitting the single conversion metric to look at a total of 5 steps that make up a user’s journey to subscription, where conversion rates can be analyzed from one step to another.
- Total number of users
- % of users exposed to the paywall
- % of users who see the paywall
- % of users who click on the paywall
- % of users who convert
Step 1 - Total number of users
Your entire audience is at this stage, so it’s our starting point for the funnel - 100% of your users.
Step 2 - Percentage of users exposed to the paywall
This is the percentage of users who visit premium content.
Why is this important?
In a Poool study analyzing 75 digital publishers’ premium content strategies, we discovered a correlation between traffic on premium content and the reader-to-subscriber conversion rate. This correlation was true up to 40% premium content visibility (which means 40% of your visitors would be exposed to premium content).
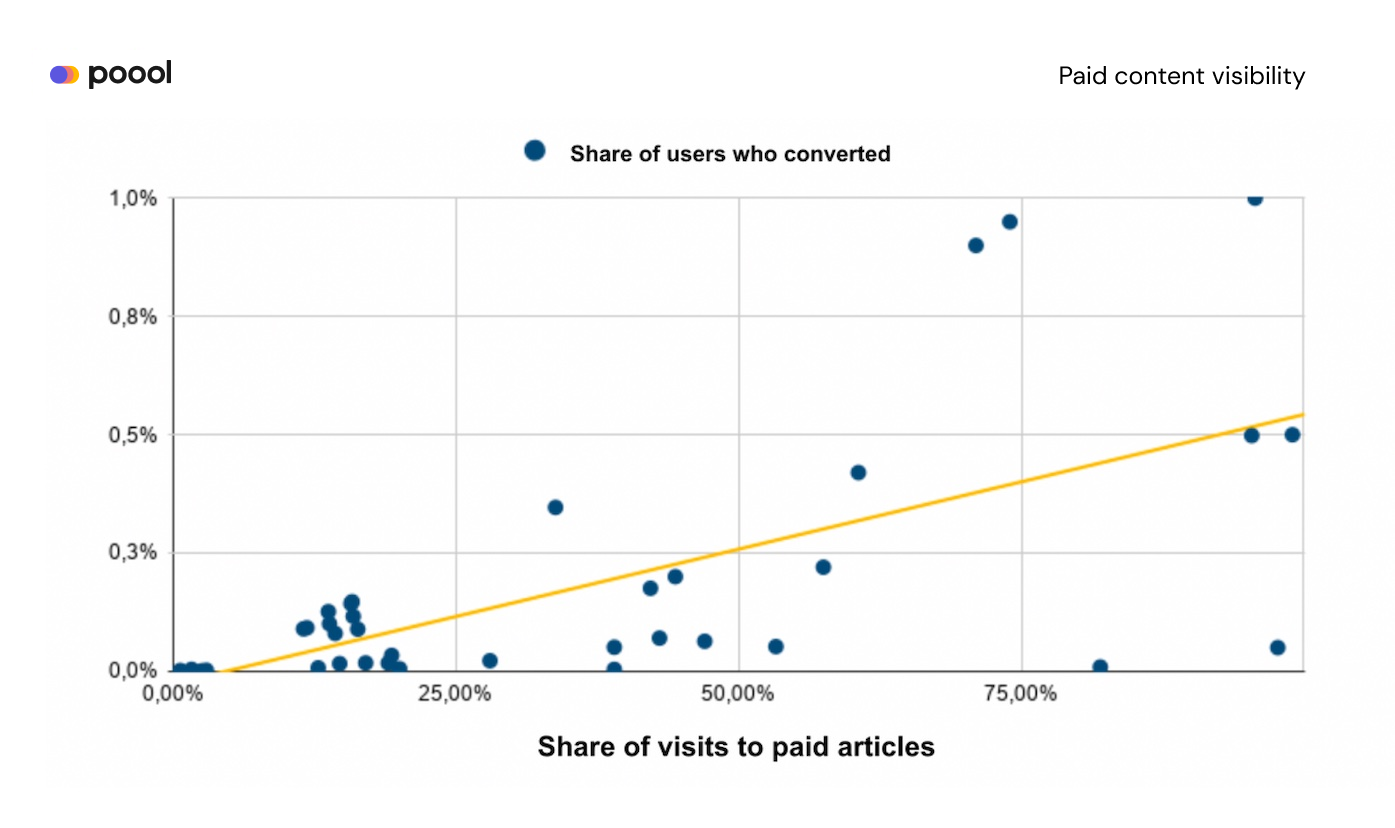
This implies that by increasing the visibility of premium content, the traffic share on these articles will also increase which will, in turn, lead to higher conversion rates.
As the limit of this correlation rests at 40%, according to our study, we’d recommend aiming for between 10-40% visibility of premium content, with the benchmark average resting at around 35%.
How can you increase the conversion rate between step 1 & 2?
To achieve this, you don’t necessarily need to produce a greater number of premium articles but increase their visibility on your website.
- Place premium content on the homepage
- Promote them inside other articles
- Recommend these articles to your users
- Place more premium content in your newsletter, on social media, etc.
Le Monde highlights premium content with a yellow tag and promotes these articles within the text.
Step 3 - percentage of users who see the paywall
This refers to the percentage of users on premium content who see the paywall.
Why is this important?
There’s often a huge loss of users between steps 2 and 3 as they visit a premium article but don’t actually see the paywall. We're therefore now talking about the visibility of the paywall itself, within a premium content.
This step is valuable because, quite obviously, the visibility of your paywall will correlate with the number of users who convert via this paywall - you can’t click-through a wall if you never see it...
For instance, although the example of Le Monde above showed that they work hard on premium content visibility, it takes 3 or 4 scrolls for a reader to actually see the paywall on these articles.
Our study found a benchmark of 30-60 percent paywall visibility, but we do see successful publishers at both extremes of this scale.
For instance, 3 of the biggest subscription-based digital publishers have a paywall visibility rate of 100%:
Financial Times presents a full-page paywall.
The Washington Post employs a pop-up hard paywall.
The New York Times blocks the full article with an anti-scroll paywall.

For these 3 publishers, 100% of users on premium content (step 2) will also move to the next stage of our funnel (step 3).
However, this isn't the best strategy for all publishers and there are other things to bear in mind, such as your dependence on ad-revenue or your need to increase engagement through content discovery.
To find the perfect visibility rate for your strategy, we’d recommend aiming for 80% and testing from here. You can also consider a metered strategy that offers users a quota of articles for free before being blocked by the paywall. This model is often valuable for increasing user engagement and reducing risks to other revenue models, advertising and SEO.
Taking this ‘ideal’ 80% paywall visibility, 28% of our original audience are left to move to step 4 of the funnel.
How can you increase conversion rates from step 2-3?
- Employ a different wall on mobiles (where the wall is seemingly further down the page than on desktop)
- Increase wall visibility with a full screen paywall - you could even consider different visibility rates on different articles, for instance a hard blocking, 100% visible wall on your most popular content
- Optimize the order in which scripts are called to the page to configure a wall to appear sooner in the case of bad connection
Readers are bypassing my paywall 😱 😱
Discover how to prevent this happening, which blocking method is best and what also you need to take into consideration (such as SEO or technical requirements):

Step 4 - percentage of users who click on the paywall
How many of these users who have seen the wall actually click on it?
Why is this important?
This is pretty obvious. But one thing worth noting is that even small, regular changes to your paywall can have a big impact on click-through rates. For instance, below is an example of a publisher who saw reignited click-through rates every time they altered the design of their paywall.
Sometimes this alteration was as simple as changing the color of the wall, which took a matter of seconds on the Poool Dashboard but led to significant improvements.
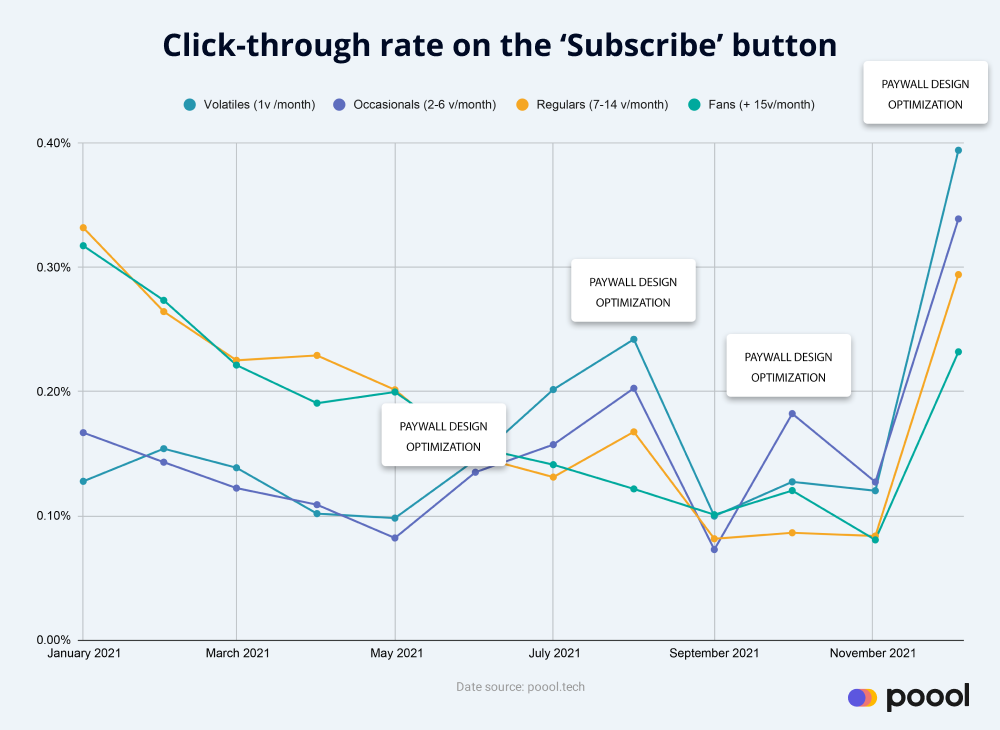
We see a hugely wide range of conversion rates at this stage, between steps 3 and 4. The market average is 0.2%, but our clients see a lot higher when following our optimization recommendations, so the target percentage of users to convert here is 3%, leaving us with 0.84% of our original audience.
How can you increase conversion rates from step 3-4?
A/B testing is perhaps the most effective and user-friendly paywall optimization method, so it’s of course something we strongly recommend publishers to do on a regular basis.
In terms of the paywall, there are 3 overarching aspects you can test:
Design - such as Journal du Dimanche who tested the color of their wall on mobile devices
Wording - Neos Kosmos tested the value proposition presented on their paywall, comparing version A that focuses on the benefits of subscription and version B which takes a more ‘support us’ approach, appealing to their reader’s culture and heritage (Neos Kosmos is an Australian-based publisher aimed at the Greek community).
User Journey - i.e. the conversion journey. For instance, ELLE tested this out to see whether a registration wall followed by a paywall performed better than a hard paywall alone. Note that, in this situation, the KPI should be less focused on conversion rates but rather overall ARPU.
Discover other A/B testing benchmarks in our dedicated article:

You can also:
- Personalize your wall based on the user’s profile or context
This could be, for instance, based on the source of traffic, the type of content, the device, the user’s location, interests or level of engagement.
This publisher employed different paywalls based on a user’s level of engagement - less engaged, volatile readers were shown the left version (the publisher’s original design) whilst more engaged, fan users were shown the wall on the right. This personalization led to a conversion rate increase of 107% amongst fan readers.
- Continuously alter paywall design to reduce habituation
ELLE, for instance, changed their wall design for different seasons, sales and national holidays.
Whilst Marianne designed a wall specifically for the French presidential elections.

Step 5 - percentage of users who convert
Again, this is pretty self explanatory, as is the importance of this step.
The average conversion rate here varies hugely from publisher to publisher, and it’s often hard to separate overall conversion rate with conversion rate through the paywall alone. For this reason, we can’t really pull out a benchmark that is of any value.
How can you increase conversions from step 4 to 5?
Well, firstly, you can work on improving each step prior to step 5 because these will have a huge impact on a user’s decision to convert or not. Specifically, as the paywall creates frustration for users, you need to counterbalance this with enough engagement for them to want to subscribe rather than leave your site. Find out more about this ‘perfect balance’ of frustration and engagement in our other article.
- Integrate parts of the conversion funnel into the paywall itself
This reduces steps in the conversion funnel, as well as the number of clicks needed for a user to convert. I.e. conversion requires less effort which creates a smooth and easy-to-pass-through funnel.
For instance, you could add the subscription offers into the paywall:
Or form fields, like Netflix who collect this important data point early on in the user’s journey.
Or even integrate payment into the wall, just like Alternative Economiques who increased conversion rates by 40% thanks to this innovative strategy.
Aside from this, you can also ensure that the conversion funnel is as simple as possible and that you reassure your reader at every step:
- Offer recognized payment methods (such as Paypal or Apple Pay)
- Allow users to create an account with an existing social platform, such as Google or Facebook
- Provide FAQ sections, contact information, dedicated support, etc
- Highlight phrases such as ‘Cancel anytime’
- Offer a free trial
- Develop a mobile-friendly version of the funnel
- Give users a choice but not too much as to make decision-making difficult (2-3 subscription offers is ideal)
EBRA, for instance, offers users a ‘Subscribe with Google’ option using Poool’s platform, making conversion easy.
So, overall, if we’re looking at the entire journey to subscription, combining engagement and conversion, we can track the overall conversion rate as well as the conversion rates between each step.
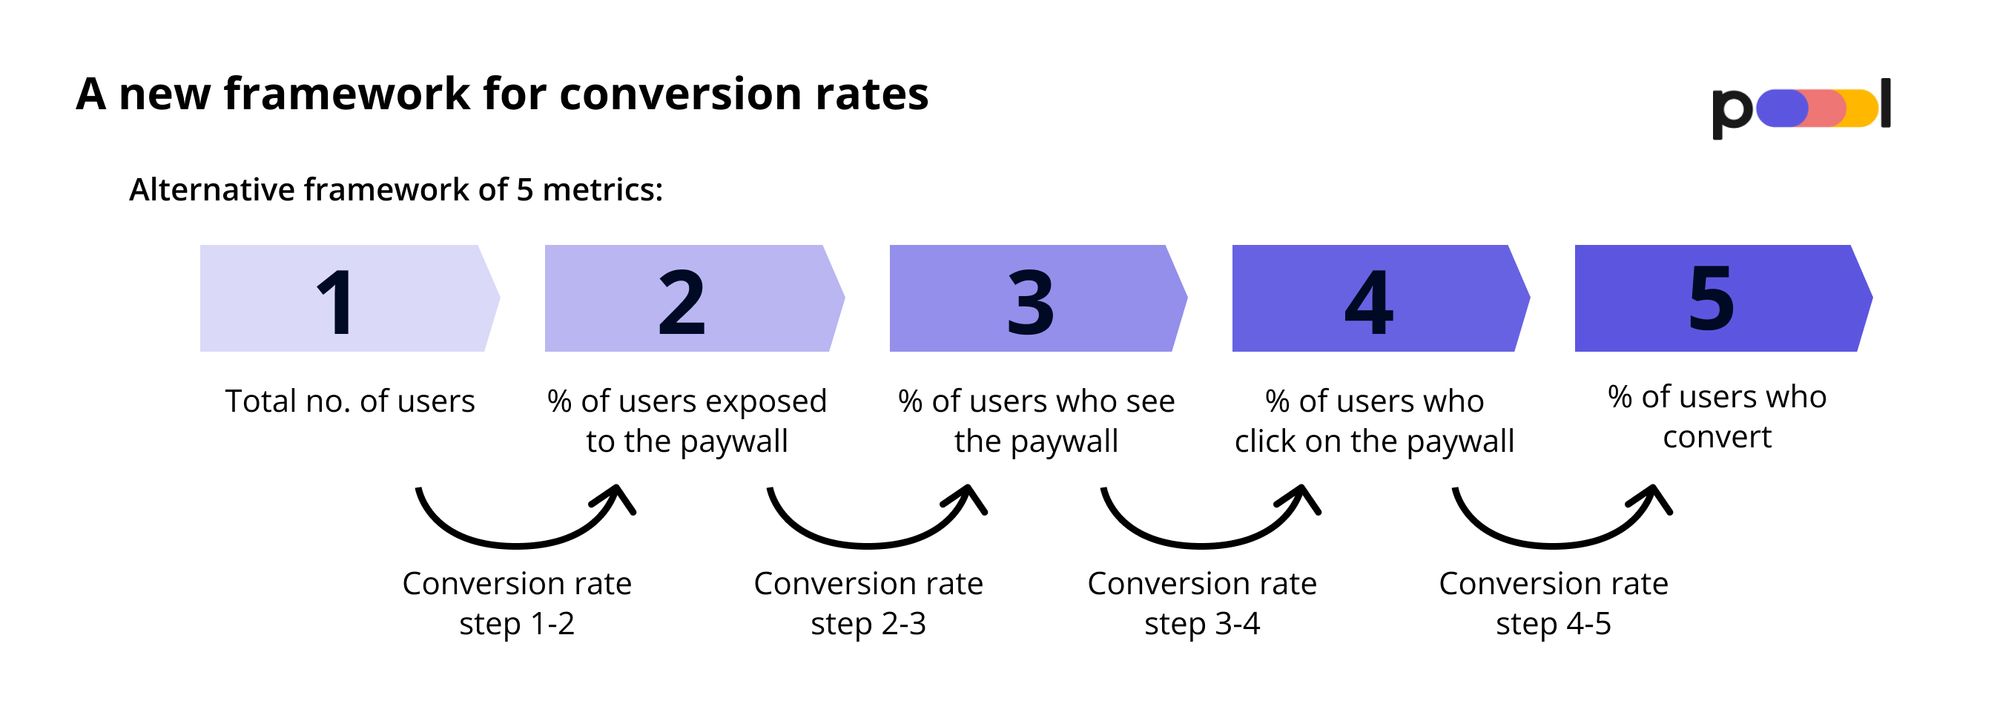
The value of doing this lies in the idea that lots of small changes culminate into significant improvements to your overall conversion rates.
For instance, if we employ some of the strategies detailed in this article and improve each step by 10% then we’ll increase click-through rates by 33% and overall conversion rates by 46%.
For a 20% improvement at each step, we’ll see CTRs improve by 72% and conversion rates by 108%.
In short, simply measuring and working to improve conversions as a single metric means you’re missing out on a hugely valuable opportunity to increase the percentage of your users who subscribe.
What else can you do to optimize this engagement and conversion funnel?
- Develop your audience on paid content
News aggregator sites play a vital role in audience acquisition for digital publishers. However, many news aggregators discourage publishers from blocking content to ensure that their articles get featured and audiences can be sent to their site. Of course, this is beneficial for acquisition, but it’s through conversion that these audiences can be monetized. Acquisition and conversion therefore need to work together.
To achieve this, you can make the most of triggers by building an adapted journey for users coming from a specific source. Le Journal du Dimanche, for instance, has made the most of the Upday and Poool partnership to allow users coming from this source to access content for free to increase engagement and allow for value proposition discovery before blocking them with the paywall.
2. Develop soft conversions
Soft conversions include newsletter sign up and free account creation, based around the idea that these help to increase engagement and propensity to subscribe.
Harvard Business Review, for instance, employs a metered registration wall to offer 2 articles for free before requiring a user to create a free account. They can then access 2 more articles per month before needing to subscribe.
You could also initially employ an optional wall with a ‘No thank you’ button to inform users of your premium model without fully blocking them.
Or consider designing a hybrid wall that offers users the option to sign up to the newsletter or subscribe.
3. Maximize ARPU throughout the funnel
Every visitor to your site is different and whilst one user may have a high propensity to subscribe and bring you a considerable amount of revenue, another may just try to access as much as possible without paying.
However, you can of course monetize these non-paying users in other ways, including advertising and cookies.
Step 1: Employ a Cookie Wall with Alternative to users who decline consent on the cookie banner, increasing the ARPU of even your least engaged users.
A Cookie Wall with Alternative appears on content and asks a user to either accept cookies or choose a cookie-free alternative way to access content, such as by creating an account or subscribing.

The options: Consent to cookies or discover melty+ premium offer
Step 2: Convert anonymous users into registered members through a registration wall to collect first-party data and increase ad-revenue through targeting. This also allows you to learn about your audience and personalize the user’s experience to increase engagement and propensity to subscribe.
Step 3: Subscription through the paywall!
Get some paywall benchmarking inspiration:
The takeaway:
Keep tracking overall conversion rate through the paywall, but consider also tracking the 5 individual steps within the engagement and conversion funnel, working hard to make small, incremental improvements to each step that will combine to have a big impact on your overall performance.
You may also be interested in:


