

Increasing audience engagement is the first step in any revenue strategy employed by a digital publisher.
Not only does it have a direct impact on monetization through advertising (more eyeballs on page, more often and for a longer amount of time), but also on conversion rates of users into members and subscribers, meaning increased ARPU.
But how do you go about tracking engagement?
This article will provide you with a clear explanation of what makes up engagement, the KPIs needed to track it and benchmarks from Poool's clients.
We'd also recommend:
 Madeleine White
What metrics make up engagement?
Engagement is one of those words that we all understand but may struggle to clearly define - it's not only about occupying someone's interest but also involving them or persuading them to participate in something.
This definition can be transferred into 3 individual metrics, together making up what's called the RFV score - recency, frequency, volume.
⭐️ Recency - the number of days since a user last visited your site.
For most content producers, the higher the value, the lower the level of engagement.
⭐️ Frequency - how often the same individual visits your site within a given time period.
In this case, the higher the value, the better, with the goal being to form a habit around consuming your content. A low frequency of visits suggests a weak or non-existent habit, meaning low propensity to register/subscribe or, for subscribers, a higher likelihood that they'll churn.
⭐️ Volume - the quantity of content consumed and interactions with your site. This basically tells you the quality of a user's visits - whether they read a lot of content, spent time on your site, completed various actions, etc.
Most engagement metrics will be based on one or a combination of these. However, as with everything, engagement is unique to each publisher and you may prioritize one of these metrics over the others.
Therefore, we'd recommend considering the KPIs outlined below and deciding which align best with your strategy, content and audience.
What specific KPIs can we use to measure engagement?
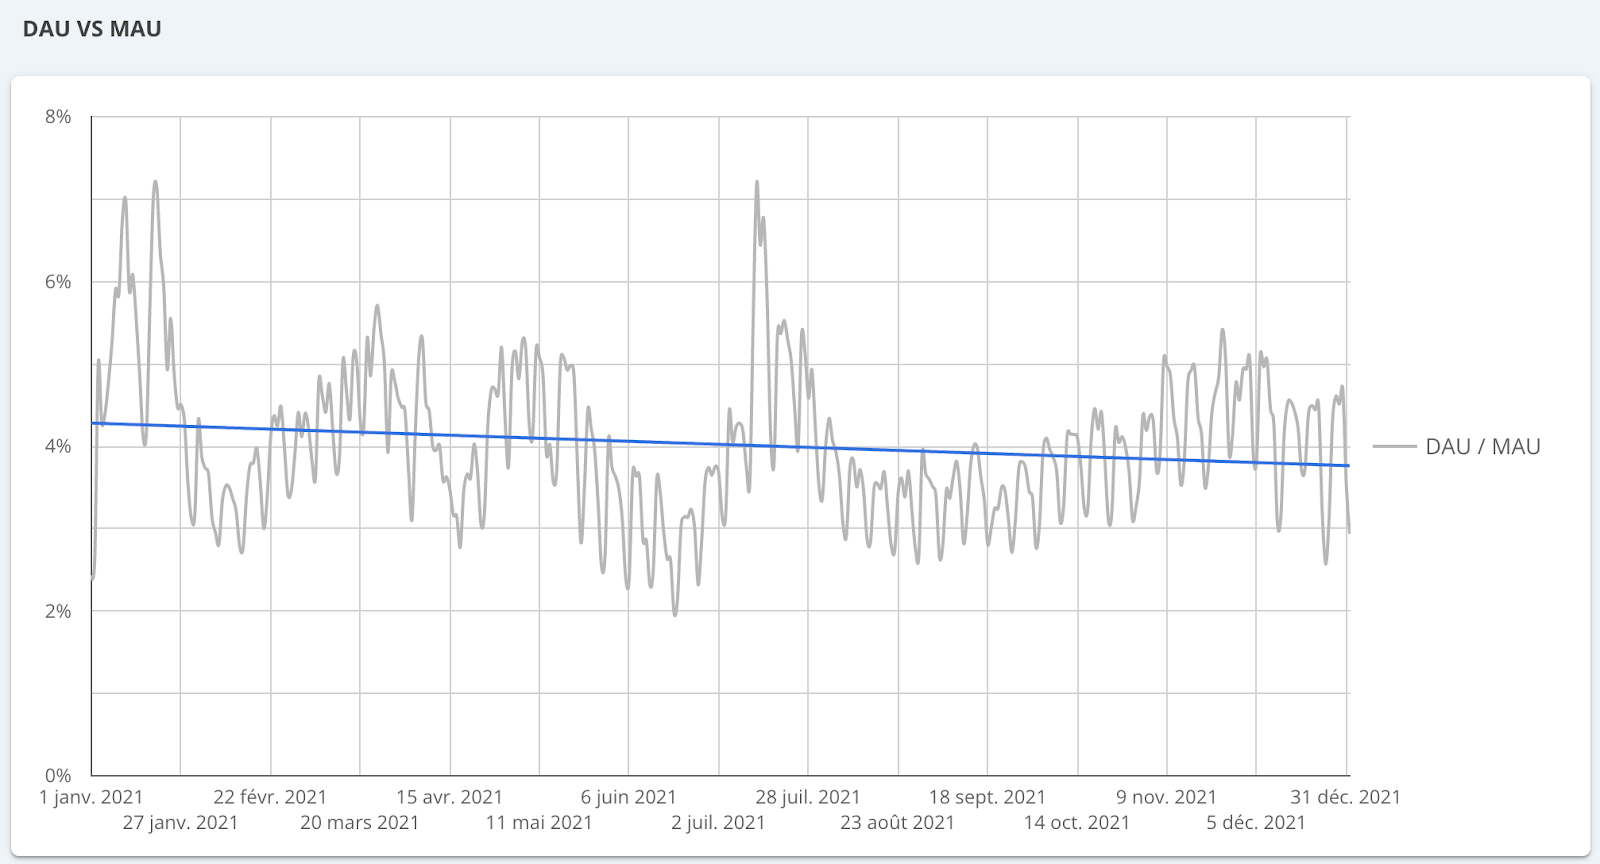
DAU / MAU ratio
= Daily Active Users compared to Monthly Active Users, also called stickiness
🎯 This measures the proportion of monthly active users that return to your site on a daily basis. It’s useful for understanding the global engagement of users and loyalty that they have to your brand (i.e. do they return to you daily for their content or other sites?).
This metric is particularly important for publishers who produce content on a daily basis (daily newspapers for instance), but for other content producers (such as monthly magazines or those who publish less regularly), this KPI can be adapted to match your own periodicity.
⭐️ We've found an average DAU/MAU of 5-8% amongst our digital publisher clients - this means that, on average, their users return to their site 5-8 days out of 28 (a month).
How can you measure DAU/MAU?
To start with, you need to define two things: Users (often quite simply a visitor to your site) and Actions (you could consider this as visits to your website in general or consuming content, such as clicking on links or scrolling a certain amount down an article).
You can then export your DAU and MAU data from Google Analytics, or other tool
🧮 'Daily' active users ÷ '28 day' active users
To visualize this data, we'd recommend using DataStudio (if you’re employing GA that is):
Engaged View Rate (EVR)
🎯 This engagement view focuses on the quality of a user's visit to your site, the idea being that users who have surpassed a certain number of seconds on-page and scrolled to a certain depth are considered as engaged in your content. It’s famously employed by publishers such as Financial Times and The Economist.
The measurement of an engaged user according to EVR differs from publisher to publisher, so you first need to settle on the number of seconds and scroll depth of your engaged visitors.
- Scroll depth: good scroll depth indicates that your content is engaging and interesting to your users. Google Analytics allows you to track scroll depth ( this article explains how) or you can consider heatmap technology
- Average time spent on page: this has to be taken with a pinch of salt and understood in the context of your specific content (for instance, some sites will want users to move quickly through each page as it suggests they found what they were looking for). You'll also notice that some publishers track time spent per session rather than on-page. Both work, but 'per session' perhaps reflects the importance of recirculation and the desire to continue to engage users even after they've read one content. Note that Google Analytics doesn't provide accurate data for this metric - instead, use:
🧮 Average time spent on page = Total time spent ÷ (sessions - bounces)
Once you understand these two metrics individually, you can create an EVR that's accurately adapted to your content and audience.
For example, at Poool, we consider an engaged user as someone who spends at least 30 seconds on a content and scrolls to 66%. We can therefore use the following equation:
🧮 EVR = (users spending 30 seconds on content and scrolling to 66%) ÷ total users
You can then put this metric to practice in measuring the performance of individual content, categories of content, based on device, source of traffic, etc.
Overall DAU/MAU is more of a global engagement metric, measuring user loyalty, whilst Engaged View Rate focusses more on a specific content.
Daily active subscribers
🎯 Track the engagement of your subscribers to see if they log into your site on a daily basis. Not only will this allow you to understand whether you have successfully formed habits in your user’s lives, but it will also help you to reduce churn and put preventative measures in place for subscribers who seem less engaged (and so likely to unsubscribe).
How can you measure this?
There are two points to track in this KPI:
🧮 In Google Analytics or similar tool, track your subscribers’ frequency of being active on your site to understand if you premium offer is engaging, if you’ve formed content consumption habits, built loyalty, etc.
This can be achieved through creating a personalized group in GA with the audience segment ‘subscribers’.
🧮 In your CRM you can also track the recency of visit of each individual subscriber to identify those who look likely to churn, allowing you to put a preventative, re-engagement strategy in place.
💡 You can apply this same methodology for a membership offer, measuring the percentage of registered members than login daily.
Soft conversion for engagement
As established, engagement is about high quality visits to your site and content on a frequent basis. Overtime, this will increase a user's ARPU and propensity to subscribe to your premium offers. So it's in your interest to seek to increase engagement.
One of the most effective ways of achieving this is through soft conversion steps, such as account creation or registering for your newsletter. These not only add value to your user's experience on your site but also help to establish content consumption habits which make a user return to your site regularly.
So, how can you track the value of soft conversion steps for increasing engagement?
Percentage of unique visitors who have signed up to the newsletter
🎯 Measuring how attractive your newsletter (and its value proposition) appears to visitors on your site
How can you measure this?
🧮 In Google Analytics or similar, create a goal of 'NL signups' and directly compare to unique visitors.
Equally, you can track the engagement of your emails themselves, including open rate and click-through rate on email links:
🧮 Email open rate = unique open emails ÷ (total number of emails sent – total number of bounced emails)
🚨 However, be aware that open rate is also related to deliverability. We’d therefore recommend checking the deliverability of your emails and putting measures in place to ensure these emails don’t go to spam.
🧮 CTR on email links = total clicks ÷ number of delivered emails) x 100
Percentage of unique visitors who have created a free account
🎯 Measuring how attractive your membership offer (and its value proposition) appears to visitors on your site
How can you measure this?
🧮 In Google Analytics or other tool, create a goal of ‘Account Creation’. You can then measure the ratio of anonymous vs registered traffic by creating a custom dimension in GA of ‘Members’.
A valuable way to increase this indicator is to employ a Registration Wall as part of your user's engagement journey towards subscription. This conversion tool blocks content and asks or requires a user to create a free account in order to gain access.
The key to a successful registration strategy is to provide value in exchange for this account creation, such as access to additional content, exclusive newsletters, UX functionalities (such as ability to save content for later, resume where they left off, etc) or perhaps access to more engaging, interactive content, like games or quizzes.
Discover the best registration wall examples of 2022:
Madeleine White
Audience segmentation based on engagement
KPIs are one thing, but putting them to use in your strategy is the next step to increasing your ARPU in the long run!
In order to effectively employ an engagement strategy, we highly recommend segmenting users based on their level of engagement and providing adapted journeys with the goal of increasing this engagement over time.
Poool segments their audience into 4 central groups prior to membership and subscription-
Volatiles, Occasionals, Regulars and Fans, each with an increasing level of engagement.
In fact, we conducted a study* of digital publishers based off these engagement levels, analyzing the averages of 3 key performance indicators:
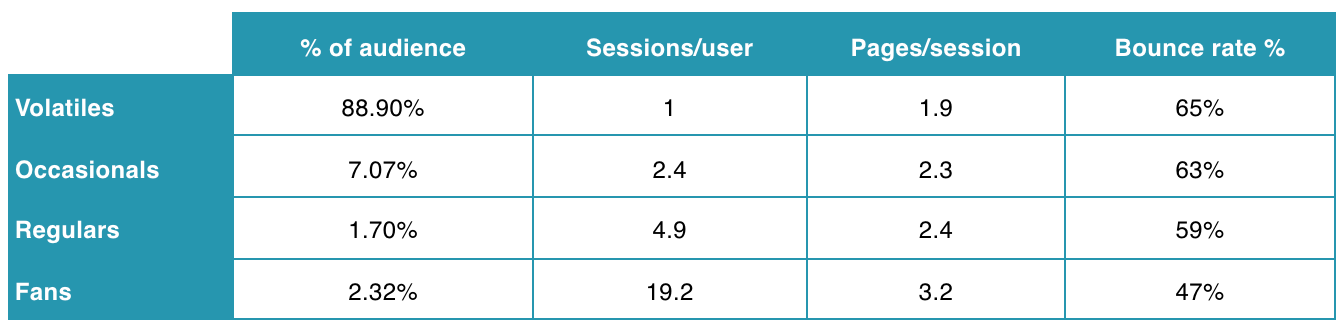
Volatiles - they make up the majority of your visits but are the least engaged. At this stage, you should focus on collecting compliant consent (to be able to at least monetize from advertising) as well as form content consumption habits, such as by encouraging newsletter sign up, recommending that they turn on push notifications or download your app.
Occasionals and Regulars - they're slightly more engaged, but this stage should be all about developing strong relationships, increasingly loyalty and optimizing the user experience. This can be achieved by converting these users into members via a registration wall strategy.
Fans - your most engaged, non subscribed users who should (by this stage) be ready to subscribe. You can therefore present a paywall to create a certain level of frustration that encourages them to click through the wall and pay to access more content.
*Poool’s study analyzed the digital audience of 42 French publishers producing a variety of written content, including regional and national press, pure-players, and entertainment content publishers. The data collected from visitors to the publisher’s site was then divided into 4 cohorts based on the user’s level of engagement, namely Volatiles (who made up 88.9% of the overall audience), Occasionals (7.07%), Regulars (1.70%) and Fans (2.32%).
Discover more content from the Poool blog:
Madeleine White Madeleine White