

After having led your user through an engagement journey, gradually increasing their propensity to subscribe, the next step is the all important conversion.
The user first passes through the paywall, then continues down the conversion funnel, completes payment and becomes a subscriber.
But we all know it’s not as simple as that - every step can be a friction point and potentially lead to a user abandoning the process. It’s therefore vital to track metrics throughout this conversion journey to discover what these friction points are and understand what needs to be done to optimize conversion rates.
This second section of the playbook will detail KPIs for each step of the conversion funnel, from premium content blocked by a paywall to subscription.
However, it’s important to highlight that conversion rates are also dependent on other factors, such as your content, value proposition and your audience’s level of engagement. Users who aren’t engaged in your content, and barely visit once a month, won’t likely subscribe even if you do have a perfectly optimized conversion funnel. Equally, if you don’t clearly communicate your value proposition or offer a premium experience that your users consider as worth the cost of subscription, even your most engaged users may not be persuaded to subscribe.
Missed part 1 on KPIs for Audience Engagement?
 Madeleine White
Engaged user to subscriber
Before working through the conversion funnel, you can put engagement KPIs to use in discovering the user behavior that leads to subscription.
These are called ‘weak signals’ and allow you to put more effort into this area as you know it supports conversion rates. For instance:
- How many articles does a user read per month before subscribing?
- What is their EVR (Engaged View Rate - see chapter 1 of the playbook)
- Is there a link between subscription to your newsletter and conversion?
- Is there a link between creating a free account and conversion?
- Is there a link between someone who consumes content across multiple mediums (website, app, newsletter, etc) and conversion?
- What about users who comment, interact with your content, turn on push notifications, etc.
The conversion funnel
The conversion funnel itself starts at the paywall and continues until your new subscriber can access premium content.
Each step of this funnel will have its own KPIs to track and should be considered as a separate part of the overall conversion ‘machine’ - if one step doesn’t do its job and isn’t properly managed, then you’ll likely not get the product of conversion.
From our conversion funnel analysis of 9 successful content producers, we found a typical user journey involved:
- Being blocked by a paywall
- Subscription offers page
- Registration/form fields
- Payment
- Confirmation and onboarding
We’ll provide KPIs for each of these steps. However, one metric can be tracked throughout the conversion funnel…
Conversion Rate
🎯 This measures the percentage of impressions that resulted in a user moving to the next step. It can be compared to click-through rate (CTR), which is often mainly used for tracking advertising or email marketing performance, however conversion rate involves completing any action (whether that be clicking or not) that moves the user to the next step of the funnel.
I.e. For each stage in the funnel, out of the number of users who reached this point and visited the page, how many converted through to the next step?
🧮 (Total number of users converted to the next step ÷ total traffic on page) x 100
This can be used to measure the performance of each individual step in the funnel, but also more globally.
For instance, how many visitors to your premium content convert into a subscriber? Or, even more global, what percentage of your site traffic converts into a subscriber? This would be measured with:
🧮 (Total number of converted users ÷ total traffic to site) x 100
1. Premium content and paywall KPIs
Traffic share on premium content
🎯 In our Digital Media Review, analyzing 75 publisher’s subscription and paid content strategies, we found a correlation between traffic on paid content and the reader-to-subscriber conversion rate, up until a certain point. This would imply that increasing traffic share on paid content will increase the number of users who convert.
To achieve this, you don’t necessarily need to produce more premium content, but simply increase the visibility of the paid content that you already produce. For instance, you can place this content higher up on your homepage, promote it in your newsletter, recommend this content within free articles, etc.
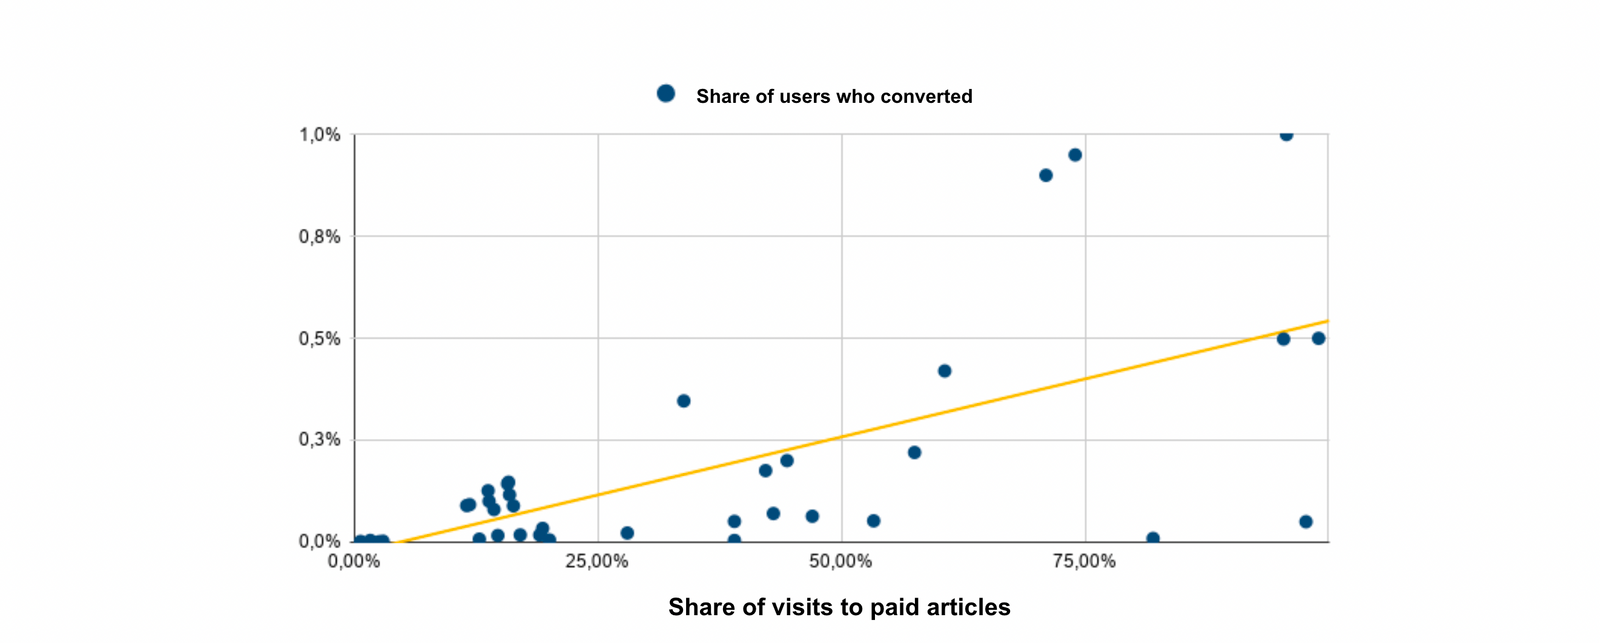
⭐ Our research found that this correlation was valid but only up to 40% visibility of paid content. Therefore, you should aim for between 10-40% visibility, putting tests in place to discover the optimal visibility for your audience.
🧮 Traffic share on paid content = (traffic on paid content ÷ total traffic on any content) x 100
Paywall visibility rate
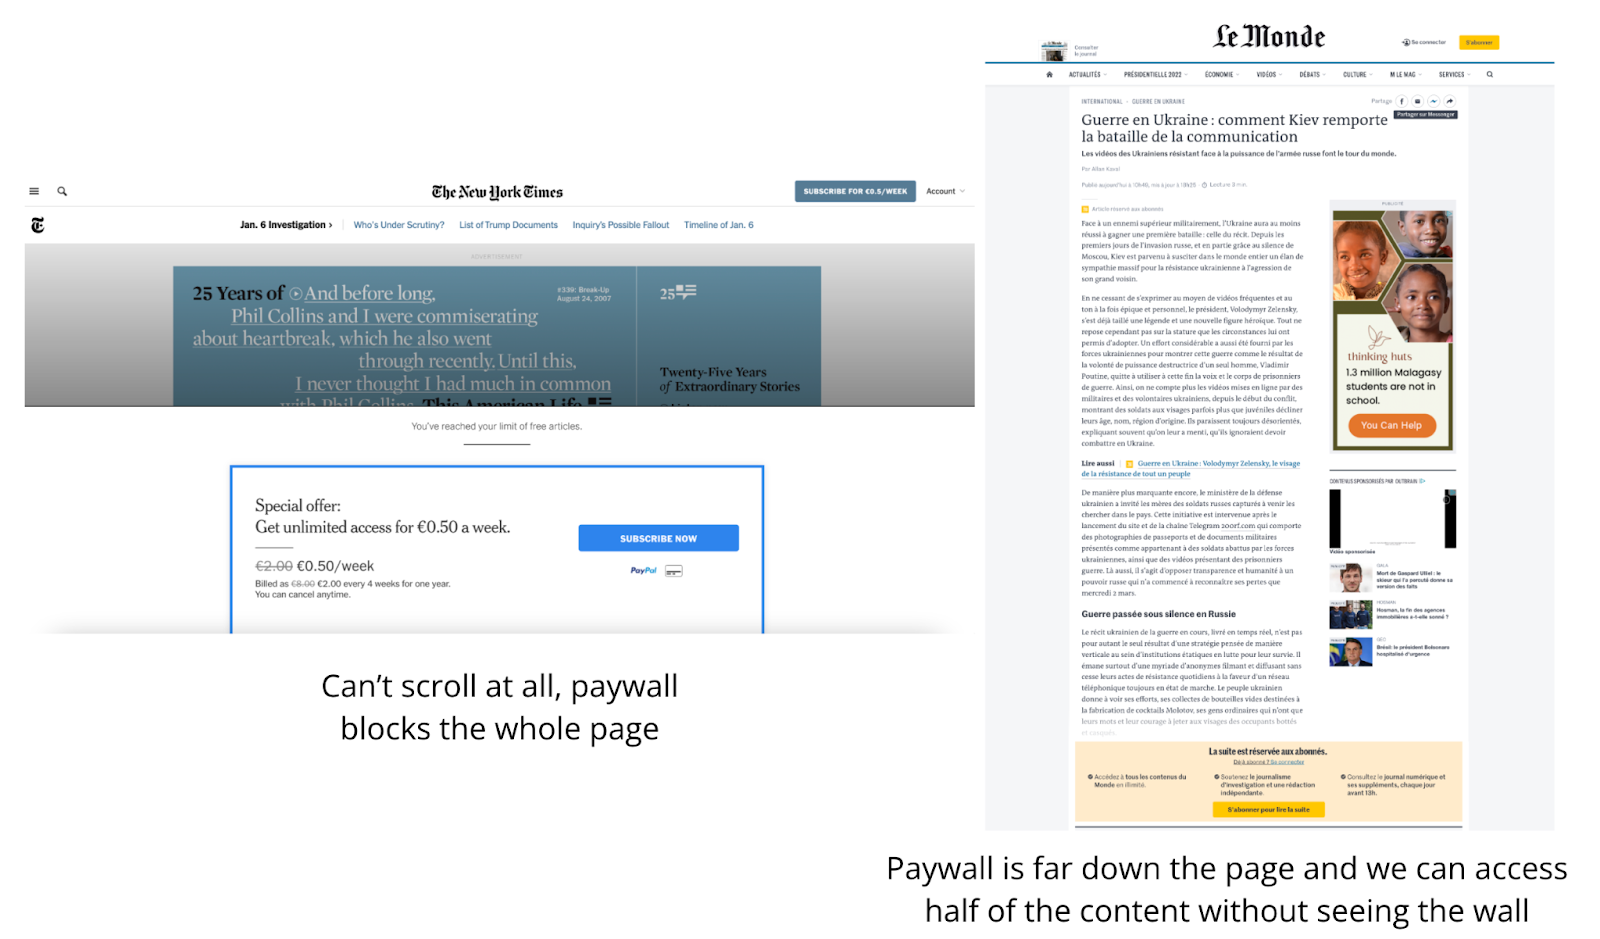
🎯 What percentage of traffic on paid content actually see your paywall? This is particularly important for written content where the paywall is far down the page and requires that the user scrolls to see it. Of course, this metric impacts conversion rates (a user who doesn’t reach the paywall won’t likely convert) and should be measured alongside scroll depth on premium content.
🧮 (Traffic on paid content who scroll far enough to see the wall ÷ total traffic on paid content) x 100
🚨 Be warned, a high paywall visibility rate isn’t necessarily optimal for your strategy.
Of course, if you have a low paywall visibility rate, you risk losing a lot of potential subscribers (and so revenue). Equally, however, if you’re reliant on advertising monetization, a full screen, 100% visibility paywall will hide all commercials and significantly reduce your RPM. The goal therefore is to find the optimal wall visibility rate based on your strategy and revenue model.
💡 Top tip - it’s also important at this point to think about SEO. By blocking your content with a paywall, you may put your SEO performance at risk. However, you can successfully find a balance between paywall optimization and reducing the risks to SEO performance by employing a ‘lead-in’ approach - this refers to a hard wall strategy that still leaves the content title and first paragraph/executive summary open to readers, allowing for both content discovery and giving search engines the information needed to rank the content.
Discover more about Paywalls and SEO in our dedicated white paper.
Maxime Moné
Meter Stop Rate (MSR)
🎯 This metric only applies to publishers employing a metered paywall strategy and refers to the share of users who exhaust their quota of free content and reach the paywall.
As usual, this metric is about finding the balance between engagement and frustration. You need to create a certain amount of frustration by ensuring users reach the end of their free sample and see the paywall, but you also need to allow them to discover and engage in your content so that they see enough value in your product to want to subscribe.
🧮 (Unique visitors hitting a paywall ÷ unique visitors) x 100
⭐ A report by the Local Media Association shows a wide MSR range amongst digital publishers, highlighting how dependent this metric is on the publisher’s business model and audience. From their research, they suggest a goal of 5-7% MSR.
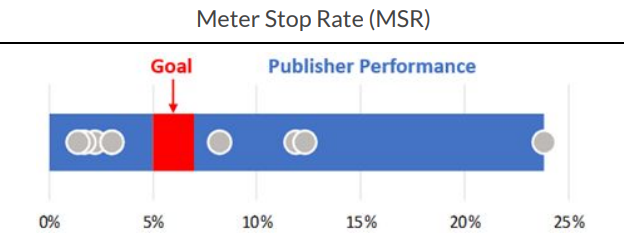
However, Poool’s own research in the Digital Media Review suggests that this benchmark has risen significantly since the LMA study. In fact, studies showed that the percentage of traffic being presented with a paywall went up by 10% in just a year, between 2019 and 2020.
Paid Stop Conversion Rate (PSCR)
🎯 PSCR tracks the number of users who hit the paywall and end up converting into a subscriber, measuring the overall effectiveness of your paywall as the first step in the conversion funnel. Of course, for any visitors who don’t subscribe, it may not be your paywall that is the problem but another step of the funnel (or an external factor), but this is still an important metric to track and compare to conversions from other parts of your site, such as CTA buttons in your menu, newsletters, etc.
🧮 (Unique visitors who click through the paywall and subscribed ÷ unique visitors hitting the paywall) x 100
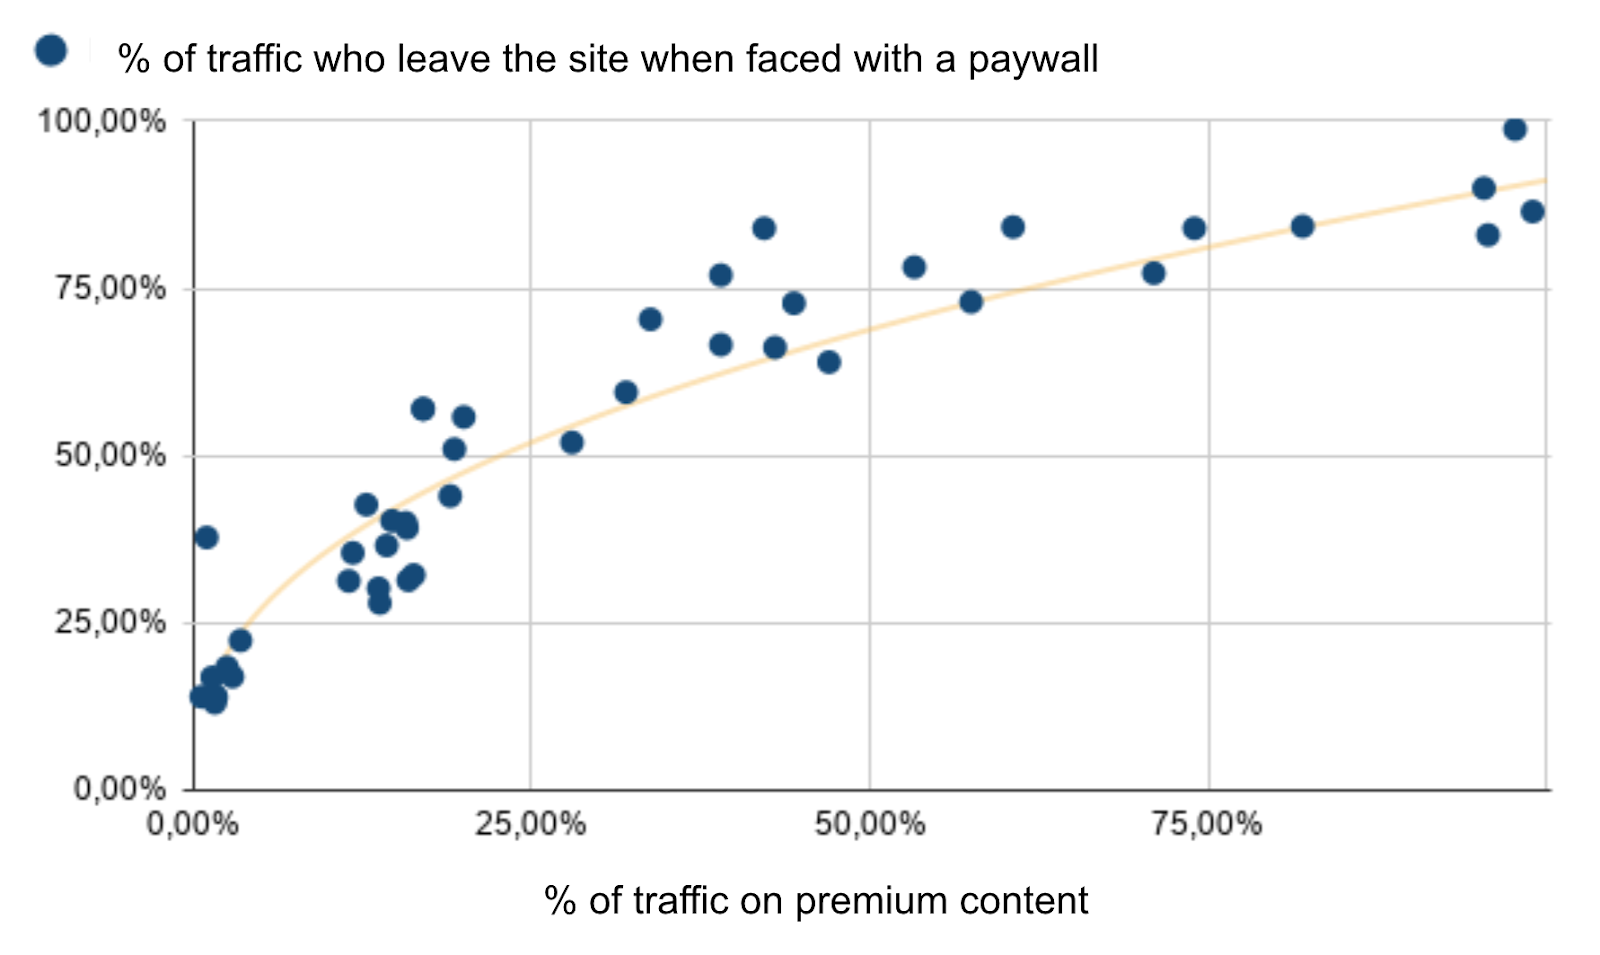
Exit rate on premium content
🎯 Find the balance between frustration and engagement on your premium content by measuring how many users leave the page when faced with a paywall.
You can track this by analyzing the bounce rate on specific pages through GA, or similar - in this instance, the bounce rate on premium content.
🧮 (Visitors on premium content who see the wall but leave ÷ visitors on premium content who see the wall) x 100
⭐ This helps to track the effectiveness of this specific step and discover friction points in the conversion funnel. Therefore, this metric can be tracked at every step - i.e. departure rate on the subscription offers page, payment page, etc.
2. Subscription offers page KPIs
(conversion rate & exit rate as the KPIs to track at every step)
Clicks on subscription offer CTA buttons
🎯 Discover which subscription offer CTA button is clicked on the most by your users, whether they end up converting or not. This will enable you to understand what users value - Do they prefer paying monthly or yearly? Do they prioritize cost? Are there certain features of your offer that they seem to value most?
💡 A/B test like crazy!
As with every step, we recommend carrying out A/B tests to discover the optimal design, wording, etc for each page. And this is certainly the case with the subscription offers page - should you highlight one offer over others, which colors perform best for CTA buttons, what value proposition points seem to convince users to subscribe?
Trial offer conversion rate
🎯 If you offer a free trial or reduced first week/month, what percentage of users who sign up for these offers then continue subscribing? This helps to discover the effectiveness of your introductory offers and can be analyzed alongside a user’s lifetime value to see if trial periods lead to long-term subscribers.
🧮 TCR = (subscription trials started in month X who converted to full-paying subscribers ÷ subscription trials started in month X) x 100
3. Account creation KPIs
(conversion rate & exit rate as the KPIs to track at every step)
Form abandonment rate
🎯 A key metric to track is the abandonment rate on the account creation form, and ideally discover where the user abandons (after how many form fields) to discover which parts are discouraging users from moving to the next step and leading to them leaving the form.
With forms that are spread over multiple pages (such as on mobile when you typically have one form field shown at a time), it’s fairly simple to discover where the friction point is within your form. However, it’s slightly trickier for single-page forms. One solution is to make some form fields non-mandatory, which helps you discover what information users don’t want to give or at what point they give up on filling out the fields.
💡 Note that employing soft conversion steps prior to the paywall can prove hugely beneficial for increase conversion rates at this stage of the funnel. Thanks to the registration or newsletter wall, you’ll have already collected key data points and can consider skipping this data-collection part of the funnel.
By making the funnel shorter, easier and requiring less information/effort from your audience, you support high conversion rates and remove potential friction points.
4. Payment page KPIs
(conversion rate & exit rate as the KPIs to track at every step)
Just as with every step, you can track conversion rates and exit rates to analyze the success of this individual step in the funnel. However, these KPIs on the payment page are more important than ever. Payment is the final decision-making stage - the point at which a user commits or not to subscribing. Therefore, although these metrics will give you insights into this specific step in the funnel, it may also indicate the success of the whole process, whether you have reassured your user enough, whether you have clearly conveyed the value you offer subscribers in exchange for payment, etc. There are many factors at play!
But, by combining these metrics with those collected throughout the rest of the conversion funnel and user journey, you should be able to figure out what needs optimizing.
Preferred payment method
🎯 Which payment method is the most popular for subscribing? This is useful for considering integrating widely recognized (and trusted) external payment companies like Paypal and Apple Pay which may be preferred by users and make the difference between subscribing or not.
You can also compare this KPI with a user’s LTV - there may be a correlation between using a certain payment method and remaining as a long-term subscriber which could benefit retention rates if these insights are put into practice.
5. Order confirmation/onboarding
(Congratulations, you have a new subscriber!)
Not every publisher will have onboarding features, so this may not be relevant to you. However, we would highly recommend this step of the funnel - it’s your first chance to welcome and engage a new subscriber, ensuring they continue to subscribe and don’t churn.
Activation rate of onboarding features
🎯 This measures whether new subscribers complete the onboarding process and activate the features or complete the actions that you recommend to them.
If you have a high activation rate (and especially if the process leads to a better user experience & increased engagement) then the onboarding is valuable, but, if not, then it might be a waste of time and have a negative impact on your subscriber’s first impression.
🧮 (Users who complete the desired action ÷ total subscribers led through the onboarding process) x 100
Tools like Google Analytics provide easy ways to track activation rate of such things as onboarding features.
💡 If your onboarding activation rate is low, dig deeper and try to discover why - is it that the process isn’t offering features that users find valuable? Or perhaps the process is too long and exhaustive.
You may also be interested in:
Madeleine White Madeleine White