

There are endless lists of KPIs (Key Performance Indicators) online, persuading businesses that they should be measuring every. single. one. 🥵
Not only would this be hugely time consuming, but it wouldn't prove valuable to your reader revenue model. You'd be overwhelmed by data, not knowing what action to take to improve performance.
Instead, you should prioritize just a few metrics (for each step in the funnel) based on your own context, setting clear goals and following performance to truly understand what actions you need to take to succeed.
This white paper seeks to help you achieve this!
We've listed the KPIs for digital publishers employing a subscription strategy, with a list dedicated to engagement, conversion and retention. And, to help you settle on the most valuable metrics to track, we've picked out a north star KPI for each of the 3 sections as well an ultimate north star KPI that we highly recommend tracking in a reader revenue model.
- KPIs for engagement
- KPIs for conversion
- KPIs for retention
- The ultimate north star KPI
Interested in implementing a successful paywall and subscription strategy? Poool have a simple, flexible platform to allow you to do exactly this, and without the need for tech support at every turn!
Book a demoKPIs for engagement
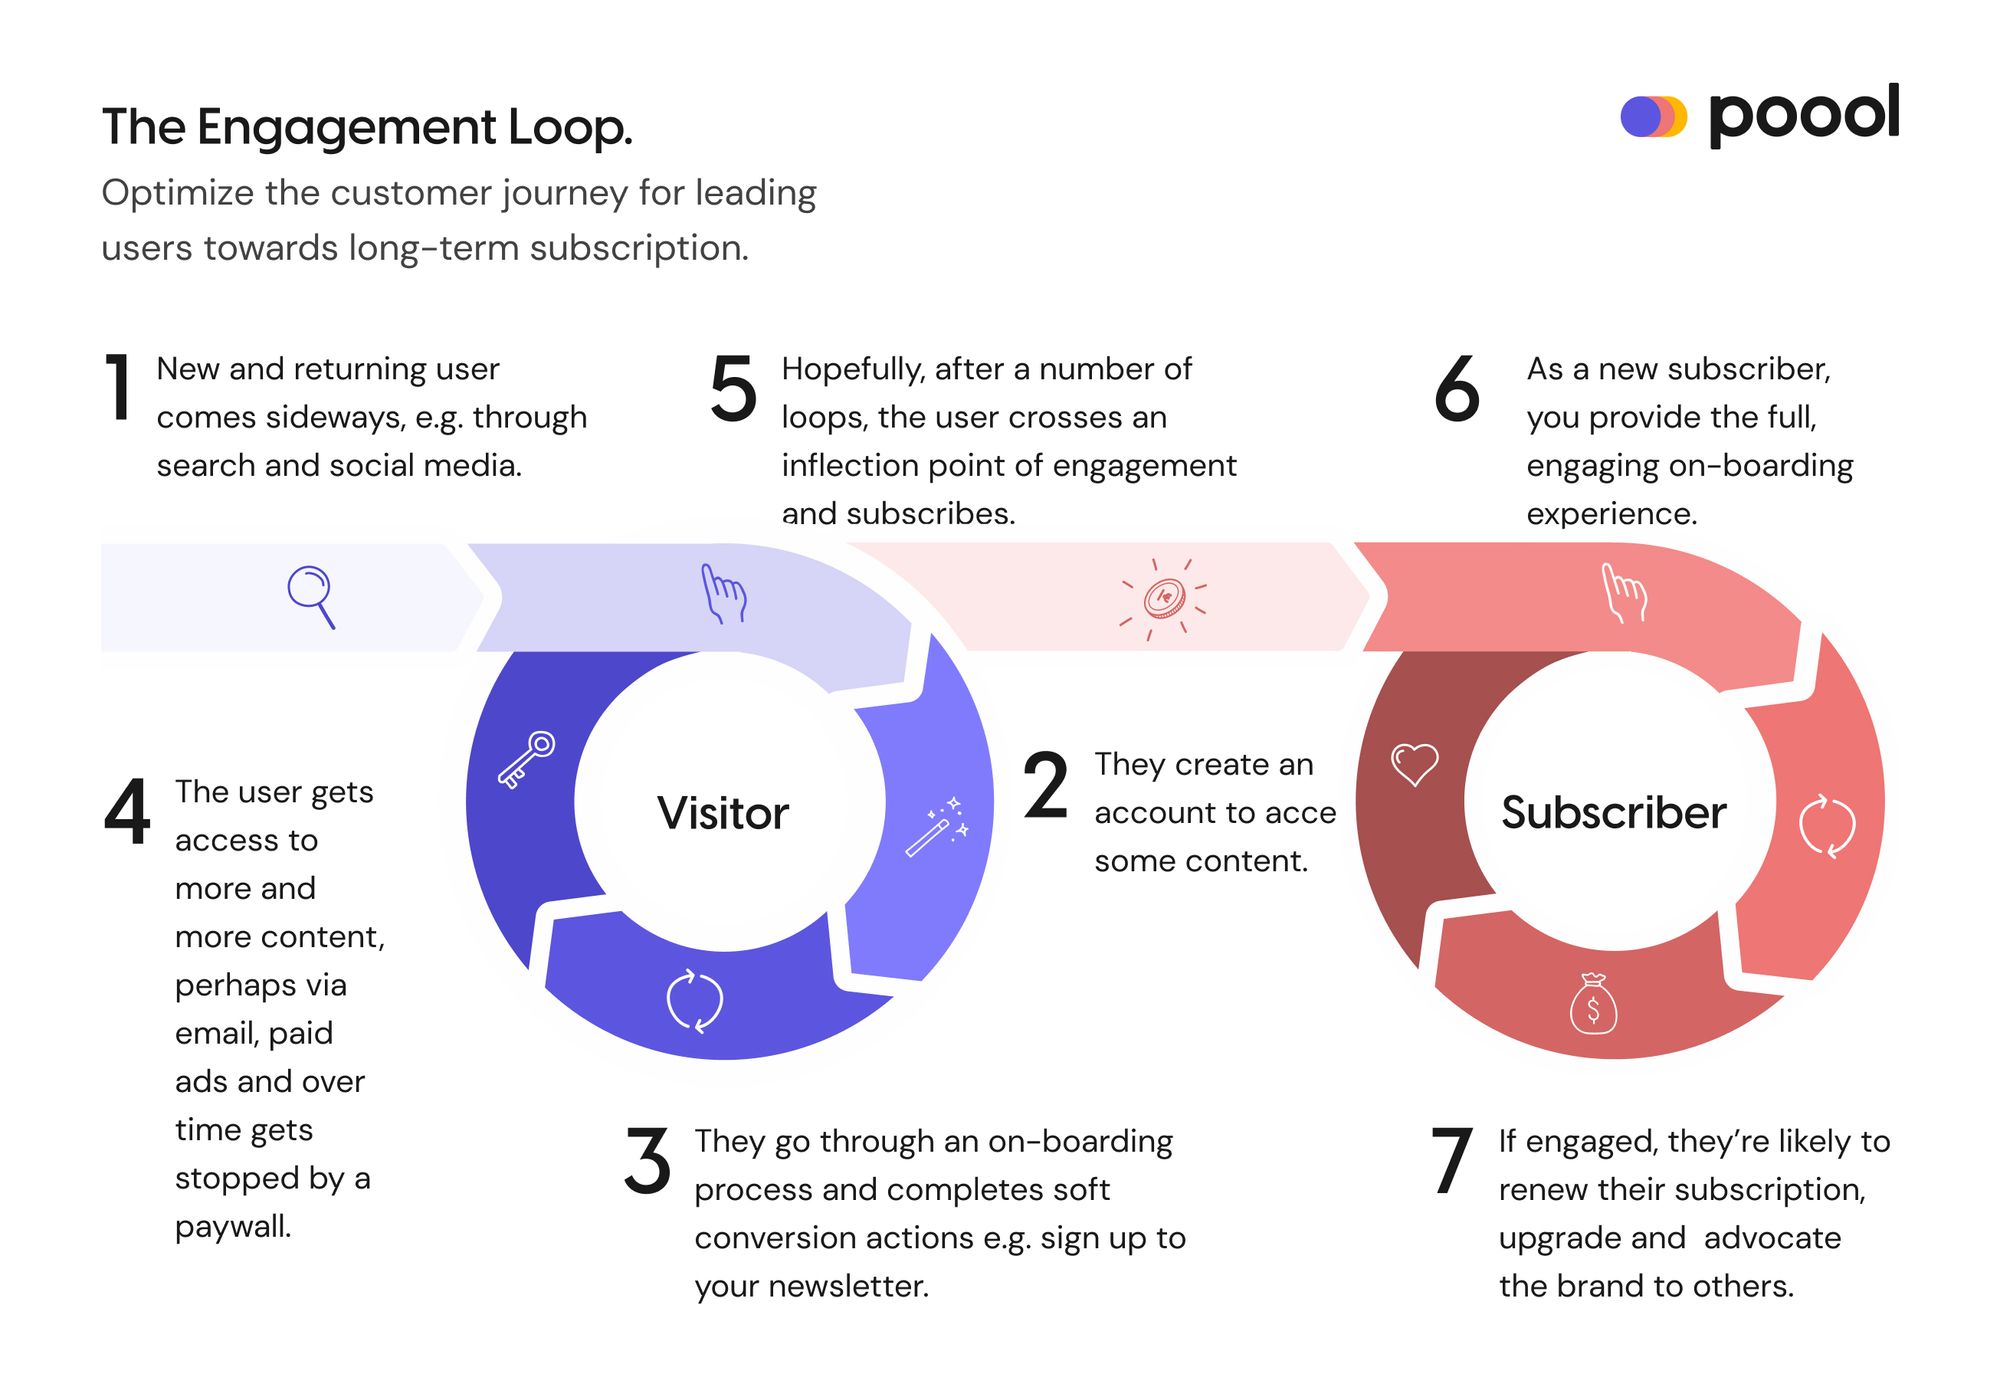
Engagement directly correlates with a content producer’s ability to generate revenue because your engaged users are the most likely to pay for subscriptions in the future.
What’s more, it’s a metric that can be tracked at every stage of the user journey, as shown by this engagement loop where a visitor who is led through a process of being increasingly engaged will end up being a loyal, long-term subscriber.
What actually is engagement?
Engagement is made up of 3 individual metrics, together making up the RFV score.
⭐️ Recency - the number of days since a user last visited your site.
⭐️ Frequency - the number of days a user has been visiting your website within a given time period.
⭐️ Volume - the amount of content consumed and interactions made with your site (basically the quality of their visits, showing that they see value in your content). It could be articles read, time spent on your website, or a mix of different interactions.
These 3 metrics combine to make up our north star engagement metric - a RFV score, or Engaged View Rate - that's used by both The Economist and Financial Times.
🧮 EVR = (users spending 30 seconds on content and scrolling to 50%) ÷ total users
This can be adapted to match your content (i.e what engagement on your content looks like in terms of time and scroll depth) and can be used to measure the performance based on type of article, device used, source of traffic, etc.
Other engagement metrics that you can consider include:
- ⭐ Average time on page: significantly more valuable than page views because it tells you how engaging your content is, providing insights into what users find important and ultimately putting you in a better position to meet their needs. This metric will differ across businesses and whilst one site might be aiming for a longer time on page (press websites for example) others will want users to move through their content quickly as it shows they found what they were looking for (such as purchasing train ticket)
⚠️ Tool’s like Google Analytics don’t provide accurate data for this metric! To correct the formula and accurately measure average time on page, use this:
🧮 Average time on page = Total time spent ÷ (sessions - bounces)
- Visited pages per session: this will show whether users recirculate on your site and are engaged enough from one content to want to access another
This article from Chartbeat provides benchmarks on recirculation from across the world.
- Bounce rate: the percentage of users leaving your site after only visiting one page. Again, the goal for this metric will differ across businesses. For some, a low bounce rate will prove that your content captivates your audience’s attention and encourages them to discover more. However, other content producers may seek a high bounce rate as it proves the site is well built and that users find what they’re looking for quickly.
⚠️ These KPIs are indeed important, however it’s more beneficial to your business to have visitors who return to your site rather than those who stay a long time or view many pages as these users are the most likely to pay for your content. This is particularly true for the press who want to create habits and become a part of their audience’s routine.
- ⭐ Returning visitors: users who are becoming regular visitors to your site (you can also track frequency of visits) and engaging enough in your content to want to return. As this audience is highly more likely to subscribe in the future, they can be nurtured and treated differently to fly-by readers in order to encourage conversion. This KPI can be measured more easily with a registration wall which will create a Custom Reader ID to more easily track a single user's multiple visits across devices.
“Registration is the first step in lifecycle relationship management. Through the leveraging of onsite data as well as A/B testing, we ascertained that people who consume two articles a month have a deep enough level of engagement with our content that they would be willing to extend their relationship with our brands. Registration after two articles allows us to put these readers on a path to purchase through engagement with our newsletters and deepening their offsite engagement with content offered on social. Presenting the registration module at two articles also showed no appreciable impact on traffic.”
- Denise Robbins, SVP of consumer marketing at The Columbus Dispatch
- Scroll depth: good scroll depth indicates that your content is engaging, informing you of the readability and interest in your content. It may also prove useful for paywall visibility rate to find the balance between engagement (allowing users to read part of the content) and conversion (blocking content with the paywall to convince a user to subscribe). You can use an event on Google Analytics to track this (this article explains how) or use heat map technology
- Registering for your newsletter: this action from a user is a good indication that you’re providing the information that they find valuable and were looking for. Not only this, but working on improving this KPI will allow you to build a large and segmented email list of engaged users who can be sent targeted messages to help conversion. Within this, you can then measure email open and click through rates on links:
🧮 Email open rate = unique open emails ÷ (total number of emails sent – total number of bounced emails)
🧮 CTR on email links = total clicks ÷ number of delivered emails) x 100
KPIs for conversion
Conversion is the action of a user moving from one step to another, moving down the funnel towards becoming a member or subscriber.
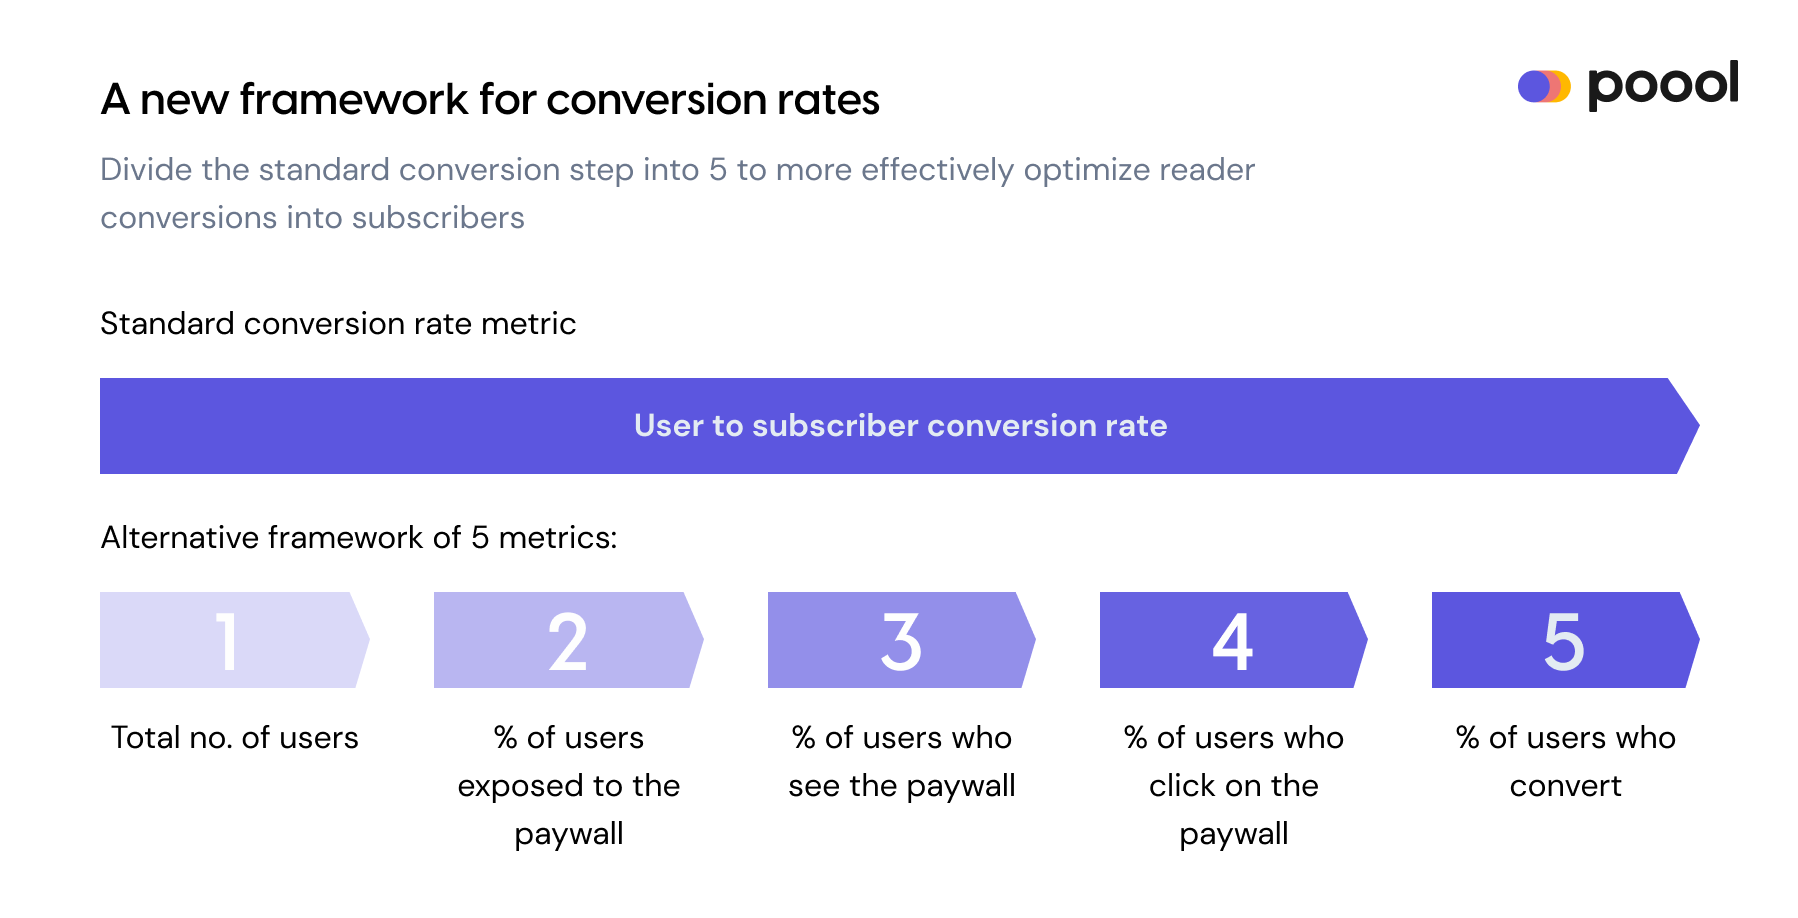
Tracking overall user-to-subscriber conversion rates is valuable, but it isn't suited to the publishing industry. Instead, it's highly more effective to combine engagement and conversion to create a 5-step conversion journey, tracking the smaller conversions in-between each step. In this way, you work on making small improvements at each step of the funnel that will accumulate into a significantly higher overall user-to-subscriber conversion rate.
- Total number of users
- % of users exposed to the paywall
- % of users who see the paywall
- % of users who click on the paywall
- % of users who convert
You can find out more about these 5 steps and how to optimize them in our dedicated white paper:
 Madeleine White
Once a user arrives at the conversion funnel, you can then track different KPIs for each step, from the paywall to subscription offers, account creation and payment.
However, Click Through Rate can be tracked for every step, measuring conversion from one step to another.
- ⭐ Click Through Rate (CTR): click through rate is the percentage of impressions that resulted in a click. It can be used in various contexts, such as by advertisers or for email marketing, but here we’re referring to a user clicking through from one step to another. So, for each stage in the funnel, for the number of users that reached this point and saw the page, how many clicked through to get to the next step?
Paywall KPIs:
(read about the different paywall types and best practices here)
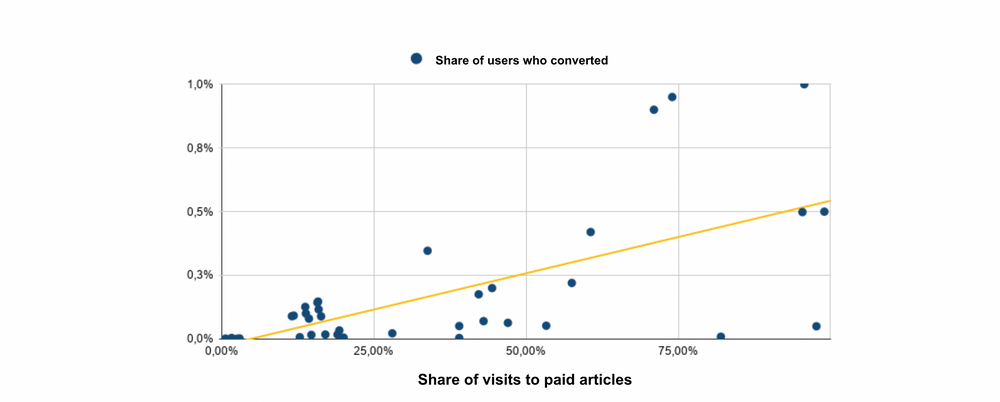
- ⭐ Traffic share on paid content: in our Digital Media Review, analyzing 75 publisher’s subscription and paid content strategies, we found a correlation between traffic on paid content and the reader-to-subscriber conversion rates. Therefore, aiming to increase the traffic on paid (as opposed to free) content can (up to a certain point) increase the number of users who convert. Note though that, as we found in our study, these premium articles should have high visibility in order to encourage subscription.
- Visibility of the paywall on page: this refers to how many users visit a premium content and see the wall. It’s particularly important for written content where the paywall is sometimes so far down the page that the majority of visitors to that article don’t scroll enough to see it. This will obviously impact conversion rates and should be measured alongside scroll depth on premium content
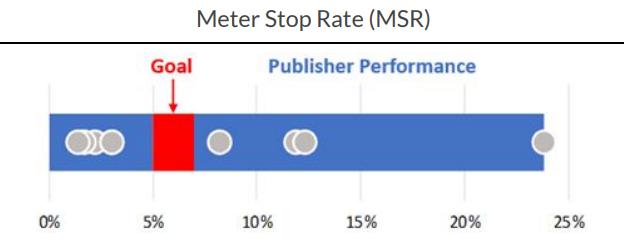
- Meter Stop Rate (MSR): applying only to metered paywall strategies, this refers to the share of users who exhaust their sample of free content and reach the paywall. Tracking this metric allows you to find a balance between being too hard with your wall strategy (not offering enough free content) and giving users the chance to engage with your content enough to want to subscribe when faced with the paywall
🧮 MSR = unique visitors ÷ unique visitors hitting a paywall
The Industry Research Report by Local Media Association & partners shows a wide variety of MSR among publishers, highlighting the difficulty in finding the right balance ‘between asking more readers to subscribe and allowing readers to sample enough content so that they are inclined to pay for a subscription’. They suggest a goal of 5-7% MSR.
- ⭐ Paid Stop Conversion Rate (PSCR): measures the overall effectiveness of the paywall as the start of the conversion funnel. It tells you how many users who hit the paywall actually convert into a subscriber. Of course, a visitor who didn't subscribe could well have been discouraged at a different step in the funnel (offers page, payment, etc), but this is still a critical indicator of conversion effectiveness.
🧮 PSCR = Unique visitors hitting a paywall ÷ unique visitors who click through the paywall and subscribe
Subscription offers:
- Trial conversion rate: this refers to the percentage of users who sign up for a free/reduced trial offer who then go on to become full-paying subscribers. Looking at this metric will help to prove the effectiveness of these introductory offers and can be combined with the user’s lifetime value (LTV) to see if the trial leads to high-revenue subscribers
🧮 TCR = subscription trials started in month X ÷ subscription trials started in month X who converted to full-paying subscribers
You'll also be interested in:
 Laure Kesler
Account creation:
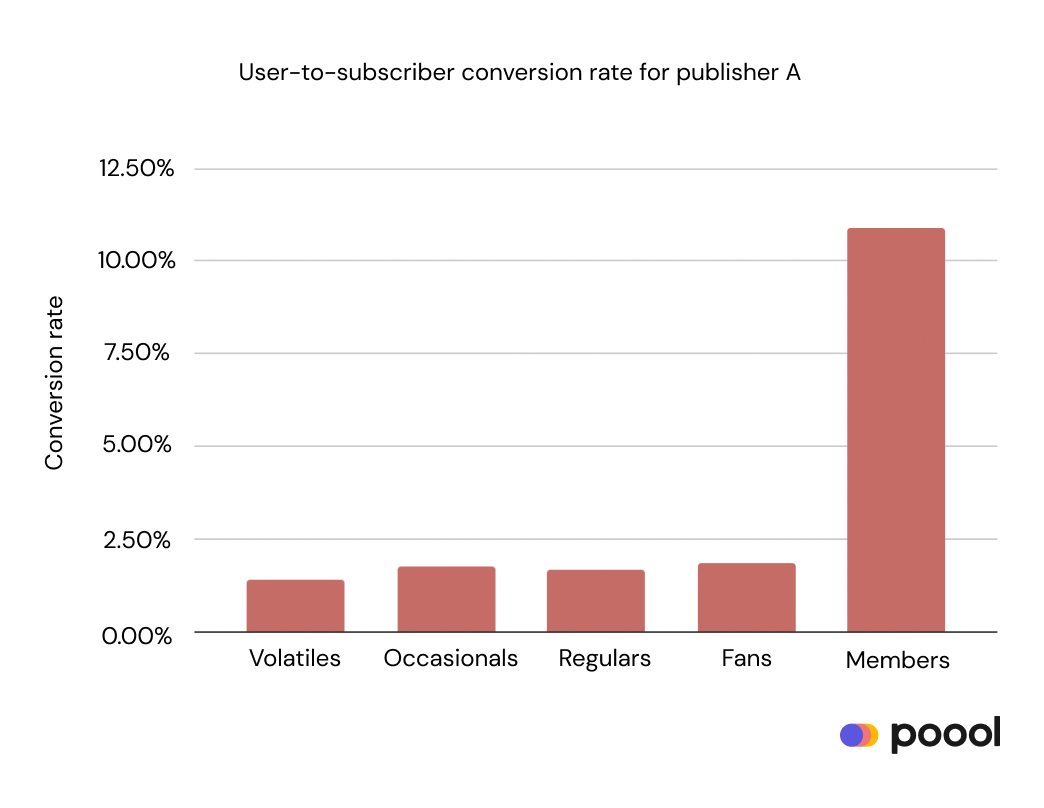
- Soft conversion rate: how many users who converted into a subscriber have already signed up for your newsletter or created a free account (maybe through a registration wall)? These soft conversions bring users closer to subscribing and are hugely beneficial for turning your audience into engaged leads. The value in this metric lies in how much energy you put into your soft conversion steps - if you find that users that have already created an account are highly more likely to subscribe, then you should prioiritize a registration wall strategy for your less engaged readers, increasing their propensity to subscribe in the future.
For example, one of Poool's clients found that registered members had a conversion rate of over 10%, significantly higher than anonymous users whose conversion rate lay at under 2.5%.
Payment:
- Exit rates: this should be tracked at every step (it’s basically the opposite of CTR) but here it’s especially important as the payment is the final decision-making stage where the user is officially committing (or not) to subscription. This metric can give you an indication of whether your funnel as a whole is a success, whether you reassure users of your value enough, whether it might be useful to offer a free trial or introductory offer, etc.
- Preferred payment method: here it’s useful to benchmark against other content producers (if possible) to see which payment methods are most trusted by your audience. For example, if online payment companies like Paypal and Apple Pay are increasingly popular, maybe you should provide this payment method as an option. To make this indicator more useful, you can compare it with the purchase success rate and a user’s LTV to see if there’s any correlations
Order confirmation/onboarding:
- Post-subscription engagement (e.g. article reading rate): this is to discover whether your audience actually consumes premium content from the moment they become a subscriber and beyond. Engagement can be analyzed differently according to the content producer but it should give you an idea of what content is most valued by new (and long-term) subscribers, ultimately informing you of what content you should produce in the future to increase retention.
- Activation rate for onboarding features: not every content producer will have onboarding features but they could include newsletter sign-up or asking a user to select content that interests them. The activation rate of these refers to whether users actually complete the onboarding process or not. You can also compare activation rates to subscriber life-time value/retention - are users who activate all of your onboarding features more likely to remain a subscriber in the long-term?
In general:
- ⭐ Monthly Recurring Revenue (MRR): generally, this is the priority KPI for most subscription content producers as it tells you how much revenue you can count on every month. With this recurring revenue stream, you can then put the cash flow into different areas of your business in the knowledge that you’ll get a similar sum in the following months. It therefore shows you the health of your subscription strategy. If you only have a single subscription offer, you can calculate just one MRR, but if you have multiple offers or various terms (monthly, annual, lifetime) you can work out a MRR for each independently
🧮 MRR = average monthly revenue per subscriber (ARPS) x total number of subscribers
- Average Revenue Per Subscriber (ARPS): you can also utilize ARPS as a KPI in itself to provide insights into whether users are upgrading or downgrading their subscription offers and link this information to the content that you’re releasing. An increasing ARPS suggests your audience see your content as very valuable and want to move to the higher offers in order to improve their experience further and access more content
🧮 ARPS = revenue from existing subscribers ÷ number of existing subscribers
- Conversion rate: this reveals how many of the total number of visitors to your site convert into subscribers. Although a seemingly important indicator, there can be a lot of factors that affect this percentage so it has to be combined with other metrics in order to be useful.
We'd recommend this optimized framework instead:
Madeleine White⭐ The north star conversion metric
- Customer Lifetime Value (CLV): indicates the total net revenue a subscriber will bring to your business throughout their entire time as a paying customer. It’s arguably one of the most important KPIs for business because you can look at it as a way to justify spending more on retention (not on acquisition). The longer a user continues to subscribe to your content, the larger their lifetime value becomes. Therefore, you should be incentivized to retain subscribers for as long as possible as it directly correlates with increased revenue from the customer over time
🧮 CLV = average recurring revenue x total length of subscription
For example, if you have an average revenue of $8 per month per subscriber and an average length of subscription of 20 months, the CLV will be $160. Specifically, this is the average revenue that every individual subscriber will bring to your business.
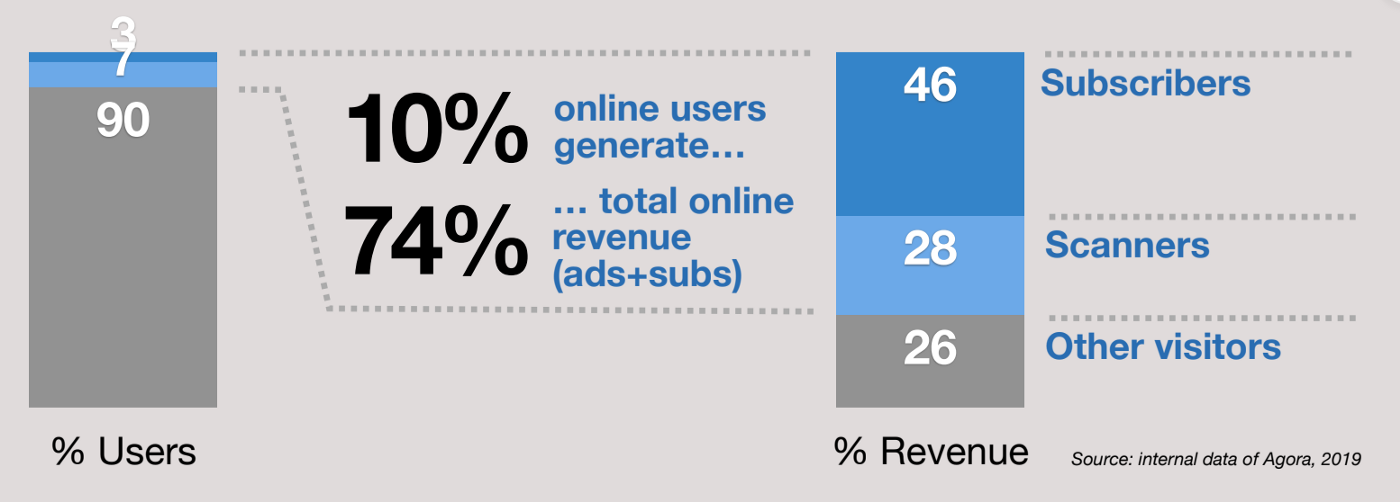
The CLV also helps to highlight that the action of converting a user into a subscriber (although important) has a smaller impact on your business than increasing the long-term value of each subscriber.
This data below demonstrates that a small number of users (long-term and valuable subscribers) generate the majority of revenue for content producers.
KPIs for retention
Retention refers to the number of customers who were subscribed the previous month (or year) and remained so (i.e. they renewed their subscription). Retention is hugely important to track and optimize because it's easier and cheaper to retain an existing subscriber than to acquire a new one.
Recommended reading to dive deeper:
 Stéphane Desmichelle
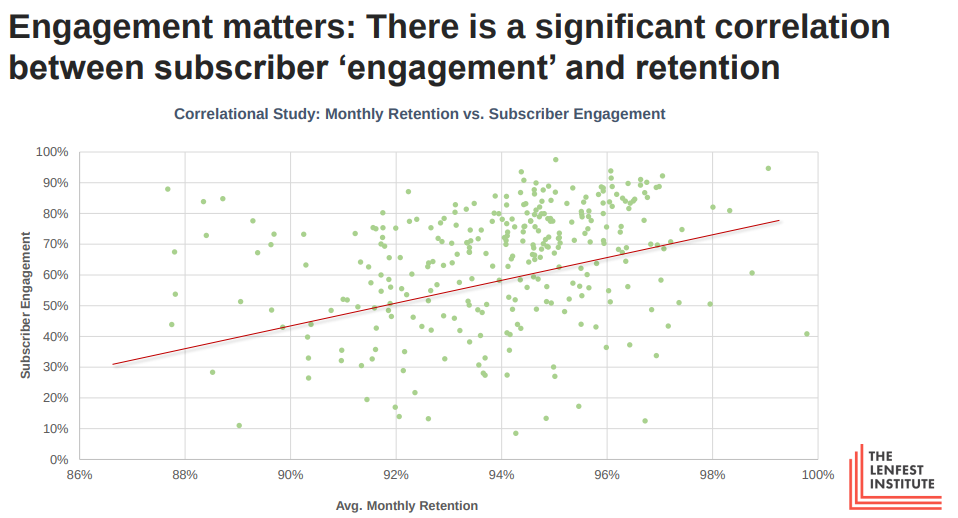
Although there are a few metrics to follow at this stage, the key to retention is to engage your subscribers. As we can see in the graph below from The Lenfest Institute, there’s a significant correlation between subscriber engagement and retention.
In terms of KPIs relating to retention, you should mainly focus on churn. This is because repeat/long-term customers are the most valuable to you, so understanding why users are cancelling their subscriptions will help you understand the source of churn and what measures you can put in place to reduce it.
“Reducing your churn rate by 5% increases your profitability by anywhere from 25 to 125%.” - Saasquatch
- ⭐ Customer churn: how many users have cancelled their subscription
Customer churn = number of subscribers who cancelled their subscription ÷ number of subscribers in the previous month
- Revenue churn: how much these unsubscribed users represent in revenue. This can be calculated by finding the MRR of the churned customers.
Note on churn prediction modelling:
Churn prediction is the task of attempting to identify subscribers who are likely to cancel their subscription through understanding typical behaviors and attributes which signal that the user is about to churn.
This information is hugely valuable to content producers who can use it to put preventative measures in places to reduce churn, such as specialized offers or incentives that encourage a user to continue subscribing.
With the increasing amount of data that you’re able to collect about your users and subscribers, especially insights into their behavior and interactions with your content, churn prediction modelling should be considered as a valuable tool to improve retention rates and increase revenues.
⭐ The ultimate north start KPI ⭐
Moving to a reader revenue model means your audience should the focus at all times, including when it comes to KPIs.
Given this, you should move from tracking overall user-to-subscriber conversion rates to instead measure ARPU (average revenue per user), moving users through an engagement journey towards subscription.
ARPU can be calculated for each individual audience segment based on the value of the actions and soft conversion steps that come prior to subscription.
How do you work out this value?
Firstly, give a monetary value to each engagement or soft conversion step. This value may well be fake (like our table below) and not based on real revenue, but the important thing is that you can track ARPU and understand the evolution of a user’s value to your business as they move through the tunnel.
For instance:
- Visits more than once a month = $2
- Signs up to your newsletter = $8
- Creates a free account = $101
With ARPU as your north star metric, you will see the value in all of the small engagement and conversion steps rather than solely focusing on conversion rates, which we now know is not optimal for a digital publisher’s reader revenue strategy.
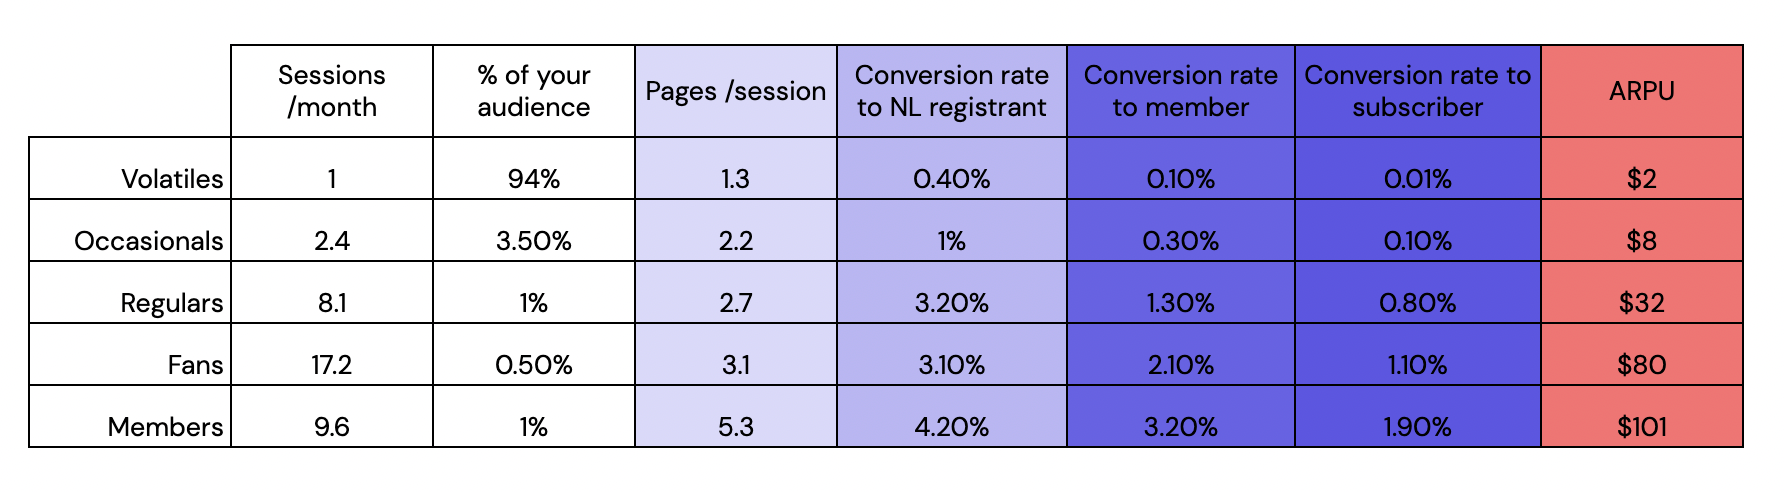
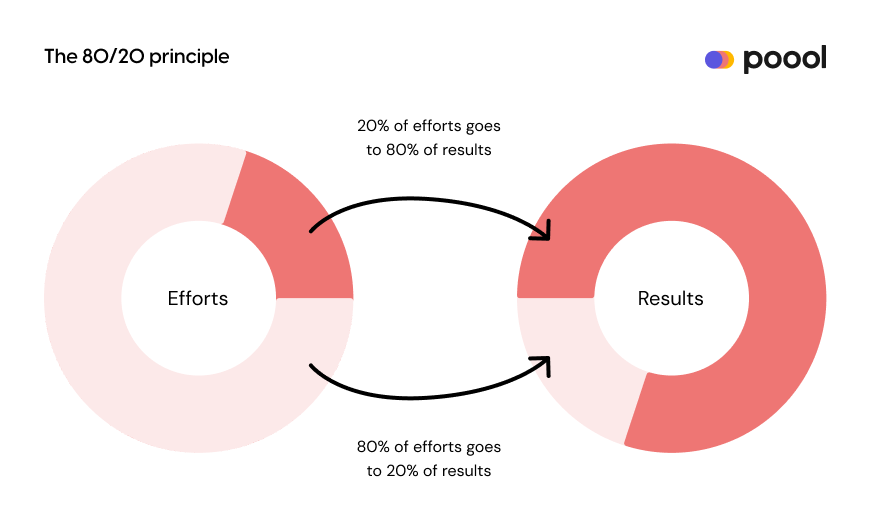
But, be aware that your ARPU is likely to look like the Pareto principle or 80/20 rule. The Pareto principle (80/20 rule) states that for many outcomes, 80 per cent of consequences (results) come from just 20 per cent of the causes (efforts).
In the context of reader revenue, this means that 80 per cent of your overall ARPU will come from just 20 per cent of your audience.
The data in the table above (real data this time, from a Poool study) shows how volatiles make up the large majority of your audience, which we can pair with the knowledge of the low ARPU of this user segment.
Fans, however, are significantly more valuable but make up a very small percentage of your traffic. This can also be said for registered members and subscribers.
Interested in launching a paywall and subscription strategy? Or optimizing one you already have in place? Book a meeting and free demo with the team to turn your audience into business!
Book a demoYou may also be interested in:
Madeleine White Maxime Moné